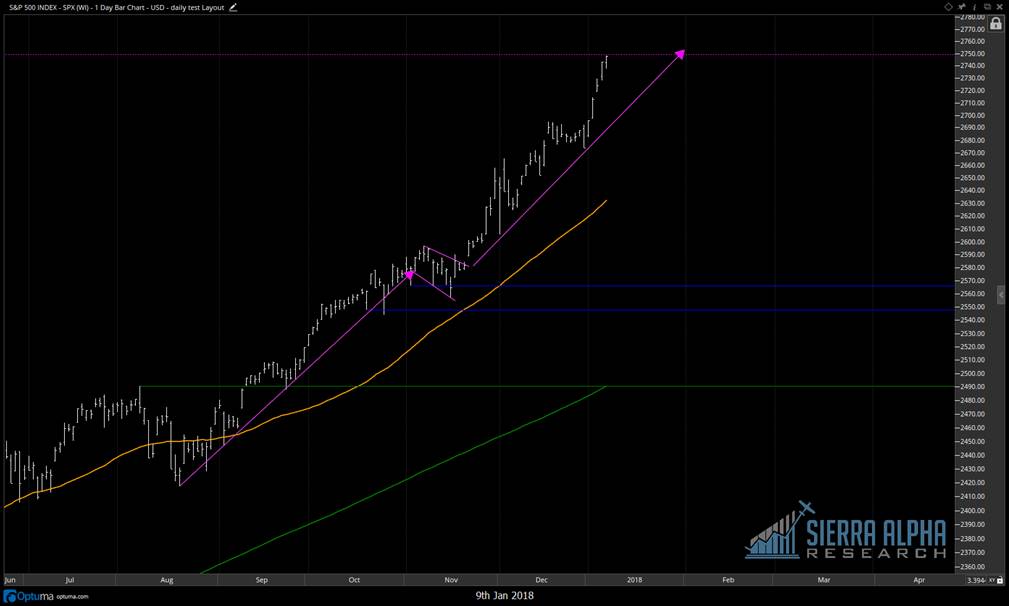
Just a quick heads up that the S&P 500 Index officially reached the minimum upside objective of 2750 that I have been talking about for the last couple months.
This is based on the bull flag pattern in November 2017. See S&P 500 chart below.
Just a friendly reminder that this is a *minimum* objective which means that the stock market could certainly go higher.
That said, this price level (2750) combined with the short-term overbought condition for stocks suggests that active investors should be on alert for a correction.
S&P 500 Chart – Initial Price Target Met
You can gain deeper insights and more meaningful analysis over at Sierra Alpha Research. Thanks for reading.
Twitter: @DKellerCMT
The author may have a position in mentioned securities at the time of publication. Any opinions expressed herein are solely those of the author, and do not in any way represent the views or opinions of any other person or entity.


 and Semiconductors (SMH): Concerning Price Pattern?")


