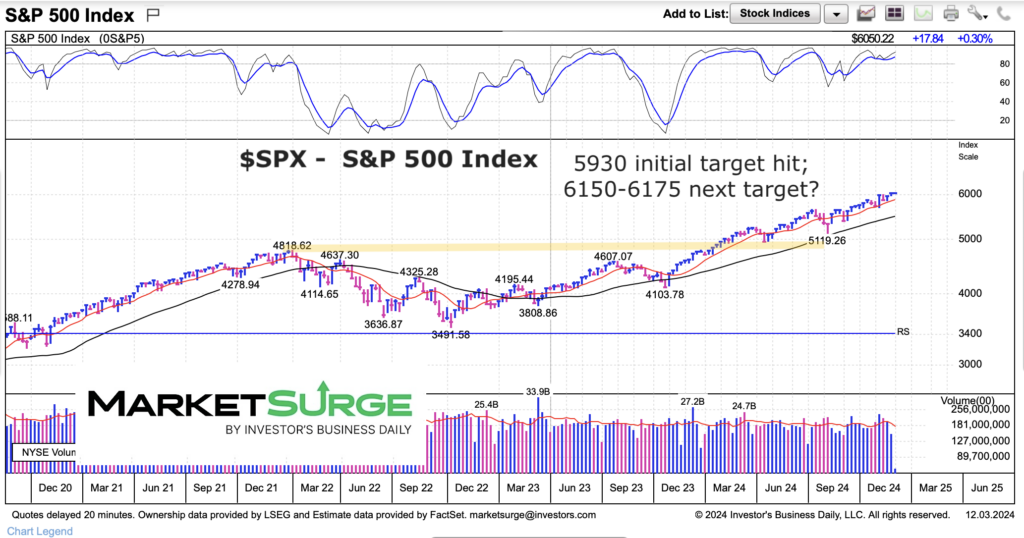
The S&P 500 has been pushing higher into year end.
In fact, the rally has taken the index above 6000, which means that the S&P 500 has surpassed our initial price target of 5930.
The next price target is between 6150 and 6180, depending on highs/lows used to project Fibonacci price targets.
We provide an updated chart below.
Note that the following MarketSurge charts are built with Investors Business Daily’s product suite.
I am an Investors Business Daily (IBD) partner and promote the use of their products. The entire platform offers a good mix of tools, education, and technical and fundamental data.
S&P 500 Index Chart

Twitter: @andrewnyquist
The author may have a position in mentioned securities at the time of publication. Any opinions expressed herein are solely those of the author, and do not in any way represent the views or opinions of any other person or entity.


