The choppy, yet steady and tight trading range that the stock market finds itself in is likely to resolve at some point soon. But as traders patiently await the next big move in the stock market, I want to share an interesting trading insight from last week regarding key S&P 500 pivot points.
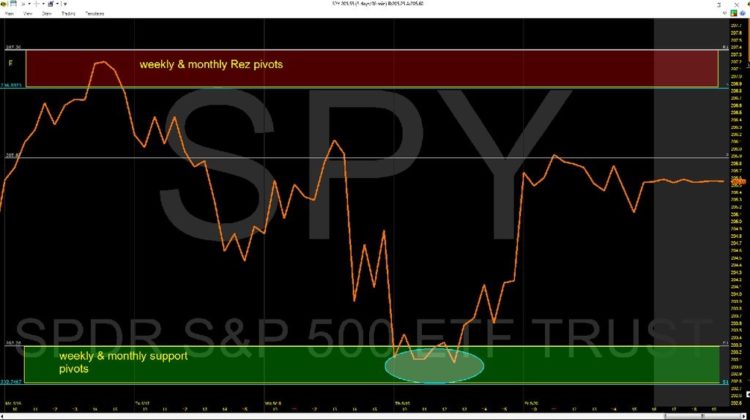
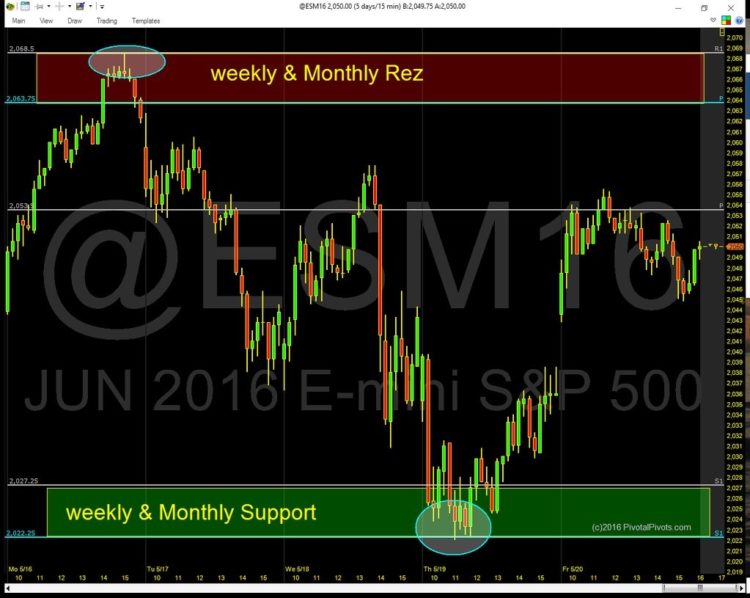
The S&P 500 Index (SPX), the S&P 500 ETF (SPY), and the S&P 500 e-mini futures (ES) all traded with precision accuracy from a high at their weeklyR1 pivot point to a low on the monthlyS1 pivot point.
This shows you how computer algorithms are programmed to buy and sell on Pivot Points. This is why I am such a strong believer and educator on this type of analysis.
Note that I did a free webinar last week on “Using Multiple Pivot Points for Trading Opportunities”. Click here to watch on YouTube.
Here are the charts showing the S&P 500 pivot points:
Thanks for reading and have a great week.
More From Jeff: The Oil Rush Of 2016 Is Almost Over… For Now
Twitter: @Pivotal_Pivots
The author may have positions in related securities at the time of publication. Any opinions expressed herein are solely those of the author, and do not in any way represent the views or opinions of any other person or entity.


