U.S. Stock Market – Key Takeaways: October weakness is contributing to the deterioration in index-level trends.
Historical seasonal patterns are improving, but investors need to see small-cap leadership before turning more constructive and putting the stock market correction in the rear view mirror.
The broad market breakdown has reached an important juncture. It’s worth noting that the unwind in investor optimism has not yet signaled capitulation.
While stocks have moved higher this week, the rally has not unwound the concerns we expressed in our last market commentary (October 18: Breadth Breakdown Puts Burden of Proof on Rallies).
In fact, the broad market breakdown has reached the point that we downgraded it in this week’s Weight of the Evidence update. This was offset by an upgrade in our view of seasonal patterns – more on both of these in a moment.
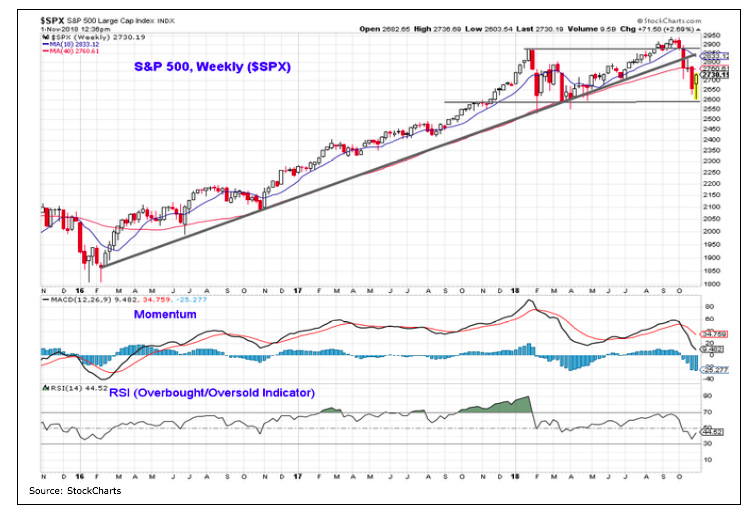
The index-level deterioration that has continued over the past two weeks has produced meaningful damage to the longer-term trends. Beyond the price-level declines that gain so much attention, weekly momentum for the S&P 500 has made a lower low after a lower high (a down-trend defined) and has moved into the lower half of the range for the RSI, evidence that we may be moving from up-trend to down-trend. Overall, this suggests that a rapid return to a sustained rally is unlikely at this point. A period of consolidation and testing may be necessary to allow positive divergences to emerge.
Based strictly on historical seasonal patterns, we are in the early stages of one of the strongest stretches of the entire four-year presidential election cycle. From a quarterly perspective, the fourth quarter of the mid-term election year through the second quarter of year three of the presidential term are not only the strongest nine-month stretch, but are the top three quarters of the entire cycle.
From a monthly perspective, the six months from November of the mid-term election year through April of year three of the presidential term has power, positive track record for producing gains (14 for 14 since 1960). This track record is a reason that we recently upgraded our evaluation of seasonal patterns in the weight of the evidence.
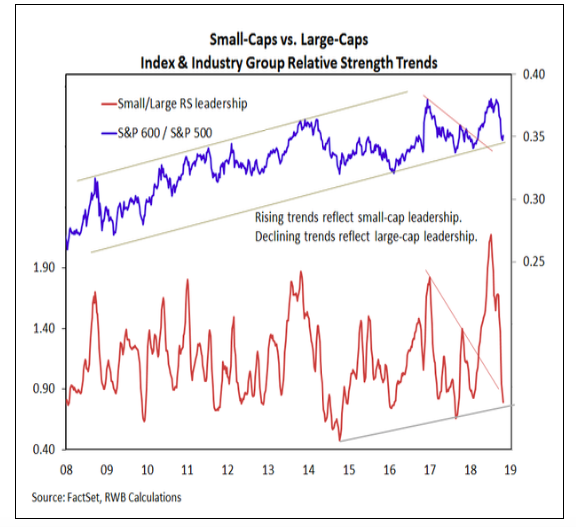
While keeping an eye on historical tendencies, we also look for evidence that these patterns are being realized in the current environment. That desire for confirmation delayed our upgrade of the seasonals and limited that upgrade to neutral (from bearish). If historical seasonal tendencies are emerging, we would expect to see pronounced (and sustained) leadership from small-caps versus large-caps and defensive sectors losing ground relative to more cyclical sectors. We have seen some of that in this week’s move off of Monday’s late-day low – but not enough to be conclusive from our perspective. To have confidence that a meaningful turn toward small-cap leadership is emerging, our industry trend indicator should detect a shift toward small-cap relative strength.
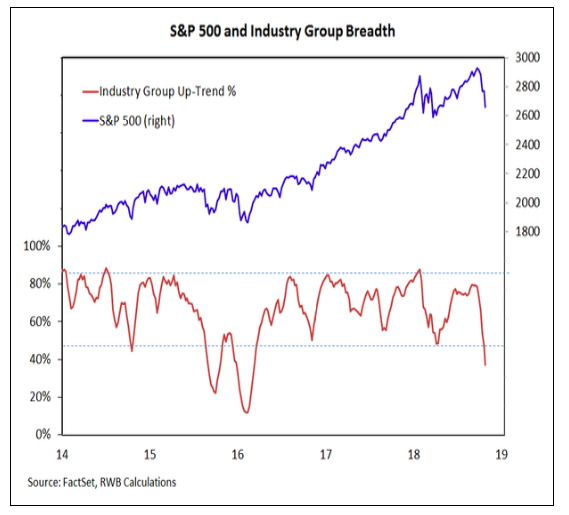
While we have gotten more constructive about the seasonal backdrop, the broad market continues to deteriorate. The percentage of industry groups in up-trends has not only moved below its early-year low (another example of a lower low coming after a lower high), but it is at a level not seen since the 2015-16 cyclical bear market. The percentage of stocks trading above their 200-day averages has plummeted and the new low list has soared (in each case eclipsing the early-2018 extremes). From a global perspective, weakness in the United States is confirming the break-down that has been seen overseas. The breadth breakdown adds to our conviction that the index-level pullback may be a more protracted affair (at least in duration if not degree) than originally anticipated.
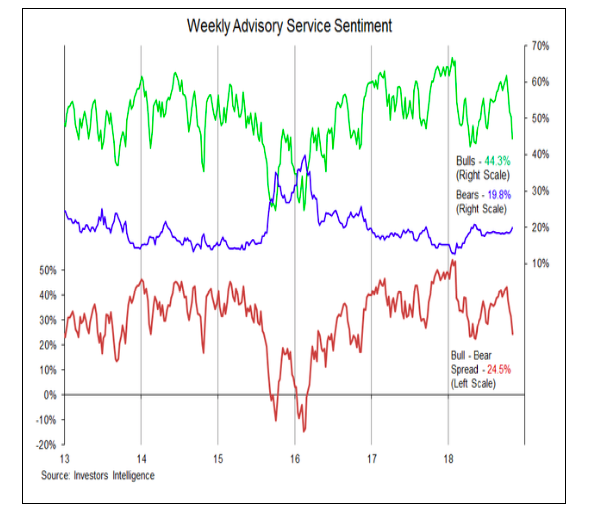
The third piece of the technical puzzle that we consider from a Weight of the Evidence perspective (in addition to Seasonal Patterns/Trends and Breadth) is Investor Sentiment. As selling emerged in October, we saw a general retreat in optimism. A meaningful and/or sustained rise in pessimism has been lacking. Looking at the Investors Intelligence data, bulls have dropped from above 60% to below 45%, but bears have hardly budged. We may need to see bulls below 40% and bears above 22% to suggest sentiment excesses have been unwound. Areas that did see some evidence of fear are seeing that already abate. Both the AAII Bulls and the NAAIM exposure index saw up-ticks this week after declines that fell shy of suggesting investor capitulation.
Twitter: @WillieDelwiche
Any opinions expressed herein are solely those of the author, and do not in any way represent the views or opinions of any other person or entity.

