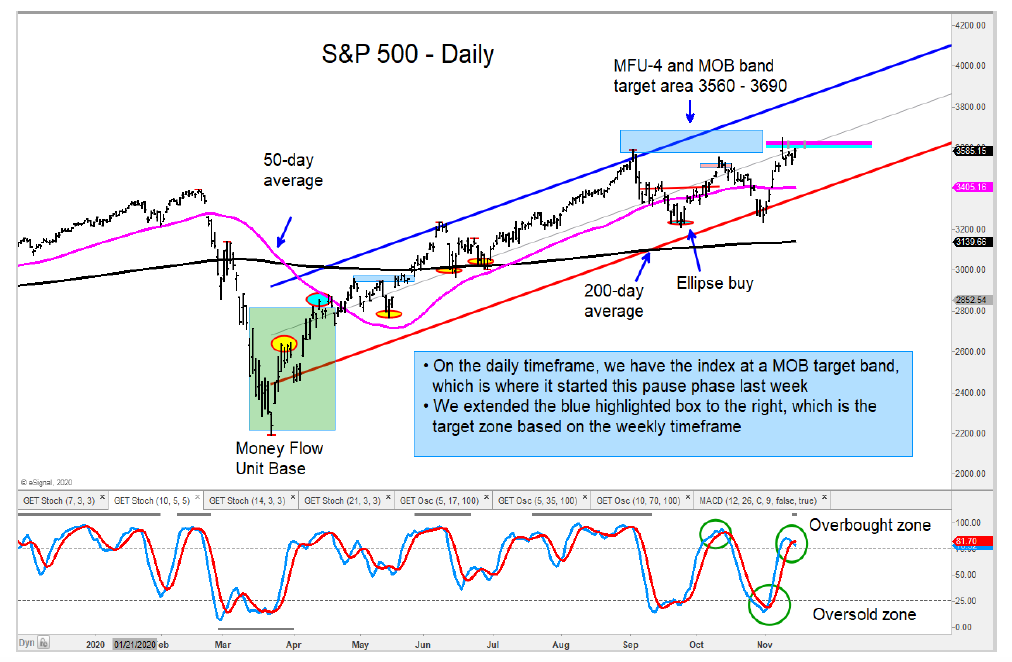
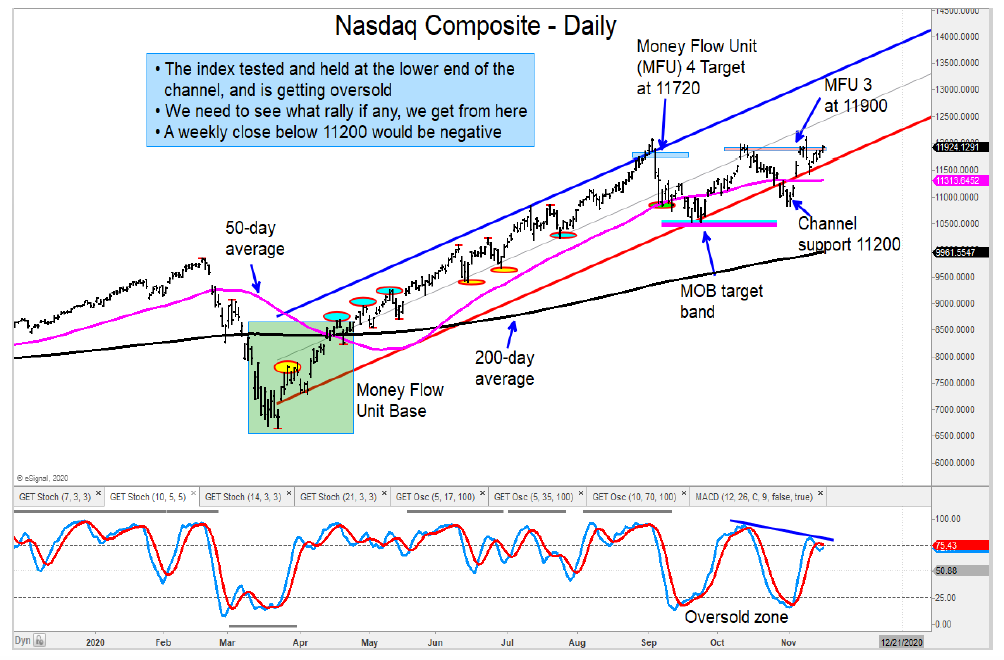
Both the S&P 500 Index and Nasdaq Composite are trading within target zones where investors can expect a pause or pullback to occur.
These price areas very well may trigger the start of a broad stock market pullback. If that occurs, then we should see negative money flow units form along with downside price targets.
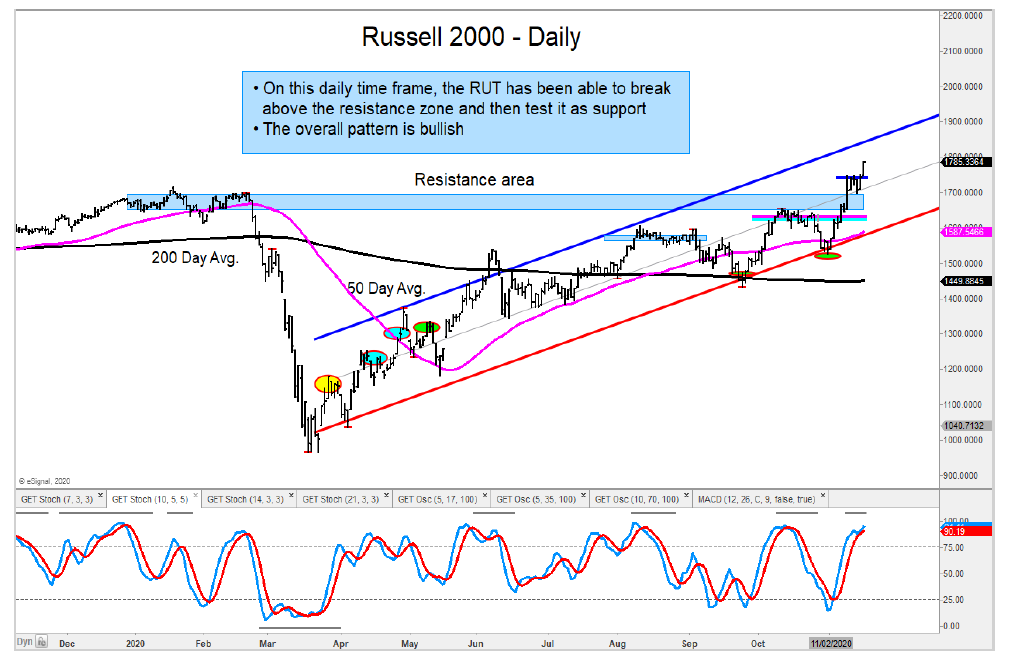
Our near-term cautious stance on the Russell 2000 and Mid-Cap Indexes (from a few weeks ago) worked out (initially) with declines of –8% and –7%, respectively. That said, both indexes reversed higher and have broken out to new highs. The breakouts have generated higher price targets from here. See charts below.
The Dow Jones Transports have broken out from a two-year base and cleared its MFU-3 target. We see another leg up to the 13660 area from here.
The Dow Jones Utilities remain in an uptrend, and we see higher prices from here.
I am shorting the long-dated treasury bond ETF (TLT) once again as price has rallied into an ellipse sell zone.
The Semiconductors Sector ETF (SMH) is back up into its MFU-4 target zone of 200. I remain cautious short-term.


The author may have a position in mentioned securities at the time of publication. Any opinions expressed herein are solely those of the author, and do not in any way represent the views or opinions of any other person or entity.


