Honey, I bought a new set of golf clubs for 40% off. What a deal!
Dearest, I also found a bargain. I bought XYZ stock at $30, and it was trading at $50 two weeks ago.
Our happy couple seems to have found some great bargains. Their purchases may be cheap in their minds, but are they? To answer the question, we need an understanding of what the right price is, not what the price was yesterday.
Why Do We Invest Our Hard-Earned Money?
There is no way to value a set golf clubs conclusively. Those that play three times a week value the latest and greatest set of clubs much higher than hacks like ourselves.
Stocks and other financial assets, on the other hand, are a little easier. Various forms of quantitative valuation methods allow a calculation of “fair value.” Such can be applied to every financial asset from the safest U.S. Treasury bills to the riskiest penny stock. The fair value for golf clubs, on the other hand, is primarily based on enjoyment, a qualitative factor.
As we will discuss and show, “fair value” allows us to objectively assess whether or not those who are buying the S&P 500 are getting a good deal.
Calculating the Fair Value of a Stock
One popular method to calculate the present value of a stock is to take its prior earnings, formulate a reasonable set of future earnings based on an assumed growth rate, establish an acceptable return, and calculate a fair value from those inputs.
Since no one can precisely know where fair value is, it is common to have a range of fair values based on various cash flow projections. Those ranges typically run from high, to low, and a base case, for example.
“Better than Best” Fair Value Estimate for the S&P 500
Just as we can forecast earnings for a stock, we can also use aggregated earnings to price the S&P 500. From those earnings we can determine if the current price is rich or cheap to what a model suggests is a fair price.
So with corporate earnings falling ill to COVID 19, we calculate a range of fair values for the S&P 500.
To run this analysis, we made the following assumptions:
- Future earnings growth – we base this on the 4.85% growth rate of earnings from 2012 to the end of 2019. The forecast makes the bold, and dare we say impossible, assumption that growth in the second quarter and beyond are unaffected by the Corona Virus.
- Acceptable return premium – we assume a 7% discounting factor based on historical equity returns
- Years of cash flows to value – we project and discount earnings for the next 25 years.
Currently, with most earnings reported, we have a reasonable estimate of first-quarter earnings for 2020. Our “better than best” case scenario uses that first-quarter data point and grows it at the prior earnings growth (4.85%) rate going forward.
This forecast is very aggressive as we know that second-quarter earnings and those further out will fall well short of these projections. While optimistic, it at least allows us to form a baseline using reliable historical data.
The current fair value of the S&P 500 based on the assumptions listed above is an S&P 500 price of 2510. The current price of the S&P 500 as of 5/11/2020 is 2911. Therefore the S&P is overvalued by about 15%, as shown below.
Even if we can magically erase the bad earnings already seen in April and have an instant “V” shaped recovery, the market is still 15% overvalued.
The graph below provides some history on the price and fair value using the same assumptions and actual prior earnings.
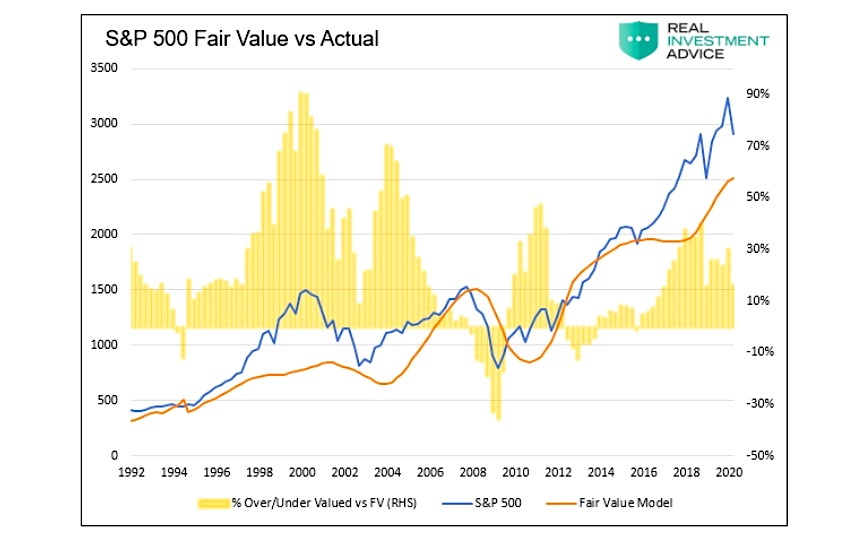
The yellow area plots the percentage difference between the price and the fair value calculation. As shown, markets often go through prolonged periods of over and undervaluation. The biggest takeaway, however, is that prices always regress to at least fair value after these episodes. A more extended history argues that when prices do revert toward the mean, they usually go below fair value.
Given that we know our assumptions used above are too optimistic consider more realistic inputs of earnings projections to calculate a range of possible fair values.
Analysis Based on 2000 and 2008
As mentioned, the above example was our “better than best” case scenario. A logical next step is to take actual earnings declines from the prior two recessions as a forecast for the next few years.
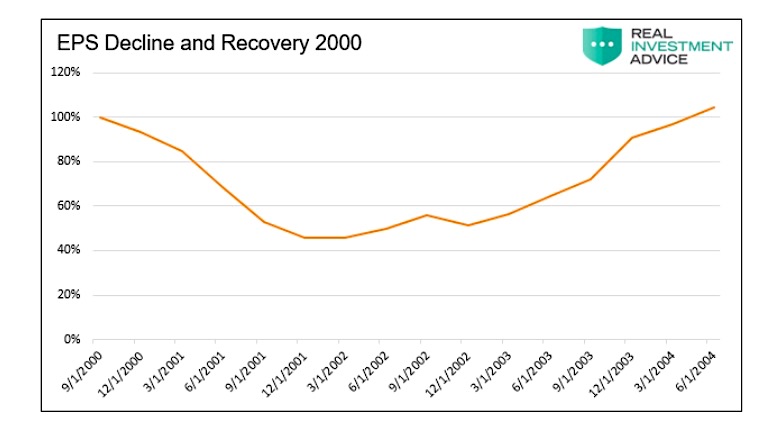
In the Dot Com Bust recession of 2001, earnings per share for the S&P 500 were cut in half and did not fully recover for four years.
During the Financial Crisis and recession of 2008/09, earnings per share fell to near zero and also took four years to recover fully.
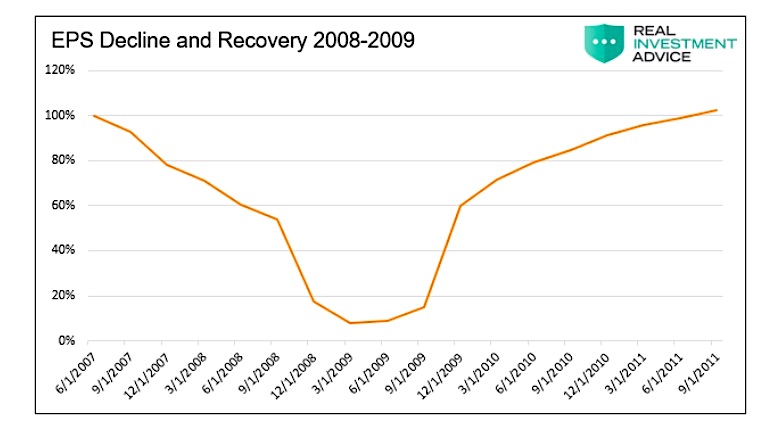
We use the percentage earnings declines and duration of shortfalls to forecast earnings for the second quarter of 2020 and outwards, as shown below.
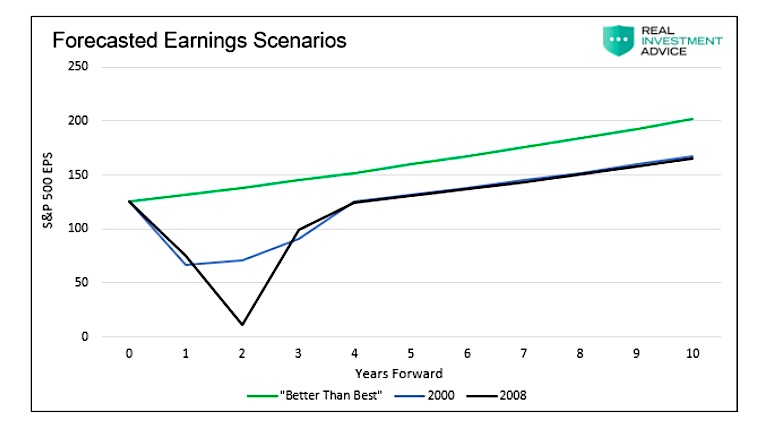
Based on the prior two recessions:
- The fair value for the S&P 500 using the earnings experience of the 2001 recession is 1980.
- The fair value for the S&P 500 using the earnings experience of the 2008/09 recession is 1926.
Both experiences imply an approximate 30%+ decline from current levels to reach fair value.
The “What if” Worst Case Scenario
What if the recession starting in 2020 is worse than those scenarios modeled above?
Given the already recognized economic impact from COVID19 and the lack of a vaccine or treatment, it is hard for us to forecast a “V” shaped recovery in the coming months. The unemployment rate is at levels last seen in the Great Depression, and GDP will join it when reported in July. Simply, the depth and breadth of this episode dwarf the prior two recessions.
We also know the diffusion, or the number of industries and other countries affected is casting a much wider net than the prior two recessions.
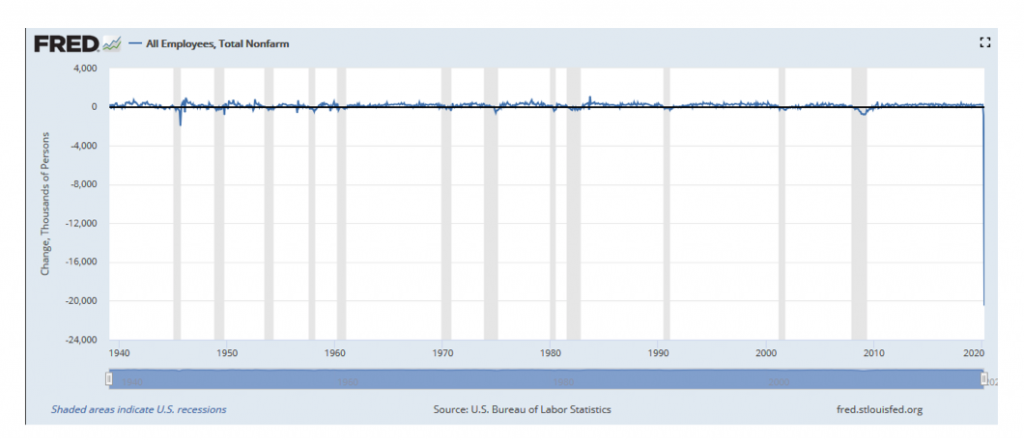
At this point, the only unknown is the duration.
Given those metrics and even not knowing the duration of the recession, a worst-case scenario, fair value calculation based on a longer duration is well below the 2000 and 2008 based forecasts listed above.
Disclaimer
Greed, fear, optimism, and pessimism about the stock market and/or economy can result in significant premiums or discounts.
However, over time, reality has a way of catching up with greed and fear and brings prices back to fair value, if only for a short time. Valuations most commonly pass through fair value on their way to being overvalued or undervalued.
In today’s environment, we must also factor in a central bank that indirectly supports stock prices.
Summary
The impressive stock rebound may continue. The markets may reach or exceed the record highs of February. Prices have well deviated from fair value, and the divergence may get worse as valuations are sustained or even rise despite the collapse of earnings.
Make no mistake; however, buying the S&P 500 15% below where it was a few months ago is not the rational investors’ idea of a bargain. Far from it, in fact.
Twitter: @michaellebowitz
Any opinions expressed herein are solely those of the author, and do not in any way represent the views or opinions of any other person or entity.

