Welcome to the information age, where investors are challenged with digesting information on a daily basis in an even faster moving marketplace. It can make days feel like weeks. And weeks feel like months. Especially if you are managing a meaningful long or short position during bouts of market volatility.
Here’s an example of how fast things have happened within select vacuums of time:
- It took just 2 weeks for the S&P 500 to really from 1881.77 (close on September 28) to yesterday’s close of 2017.46.
- It took just 8 trading sessions to drop from 1995.31 (September 16) to 1881.77 (September 28).
- And it took just 5 trading sessions to drop from 2096.92 (August 18) to 1867.61 (August 25).
So what’s the point? Twofold.
First, no matter how you cut it, these moves can be exhausting. If you are a trader, you are likely battling (and embracing, at the same time) your mental desire to speed up your time frames to take gains or cut losses due to market volatility. If you are a longer term investor, you are biding your time through the volatility but likely fighting some second guessing and what ifs. And lastly, if you are trading less and staying on the sideline, it’s probably eating away at you.
Second, this isn’t a bad thing.
… unless you allow it to be. This is a time when trading and investing approaches/plans and mental toughness are tested – it’s up to us to understand ourselves and our time frames, and to determine what action we take. Do we trade a lot, or a little? And how to define our risk, etc.
Okay, enough on that. It’s time to get to the market update. Let’s look at the charts to see how the price action is setting up.
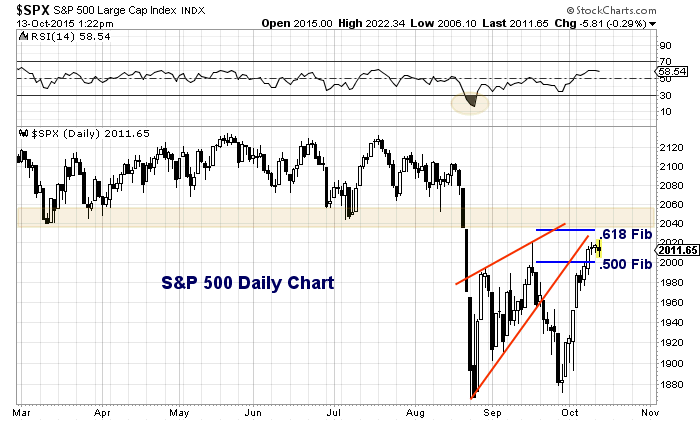
On the daily chart below, you can see how the S&P 500 is backtesting (retesting) the broken bearish wedge line, as well as the .500 and potentially .618 Fibonacci levels. Note that the .618 resistance level is just below the MAJOR lateral resistance area around 2040-2060. These levels will serve as near-term technical resistance for the S&P 500.
This seems to fit another short-term indicator – DeMark setup analysis – which puts the S&P 500 on bar 8 of a daily 9 sell setup. This could see the market begin a pullback by the end of week. The character of that pullback will be telling.
S&P 500 Daily Chart
So how do I assess the current setup? It’s hard to have conviction here. Bulls have recently neutralized the bears position with a strong rally. But line of demarcation may reside at the 2040-2060 resistance level. Longs can lighten up into it and get long out of it (if higher), while shorts can trade against it (and cover on a breakout above it). But these are just thoughts from an active investor.
To be fair, if you are even longer-term (and mentally tough), then your line(s) of demarcation are even wider… perhaps the highs vs the lows of 2015.
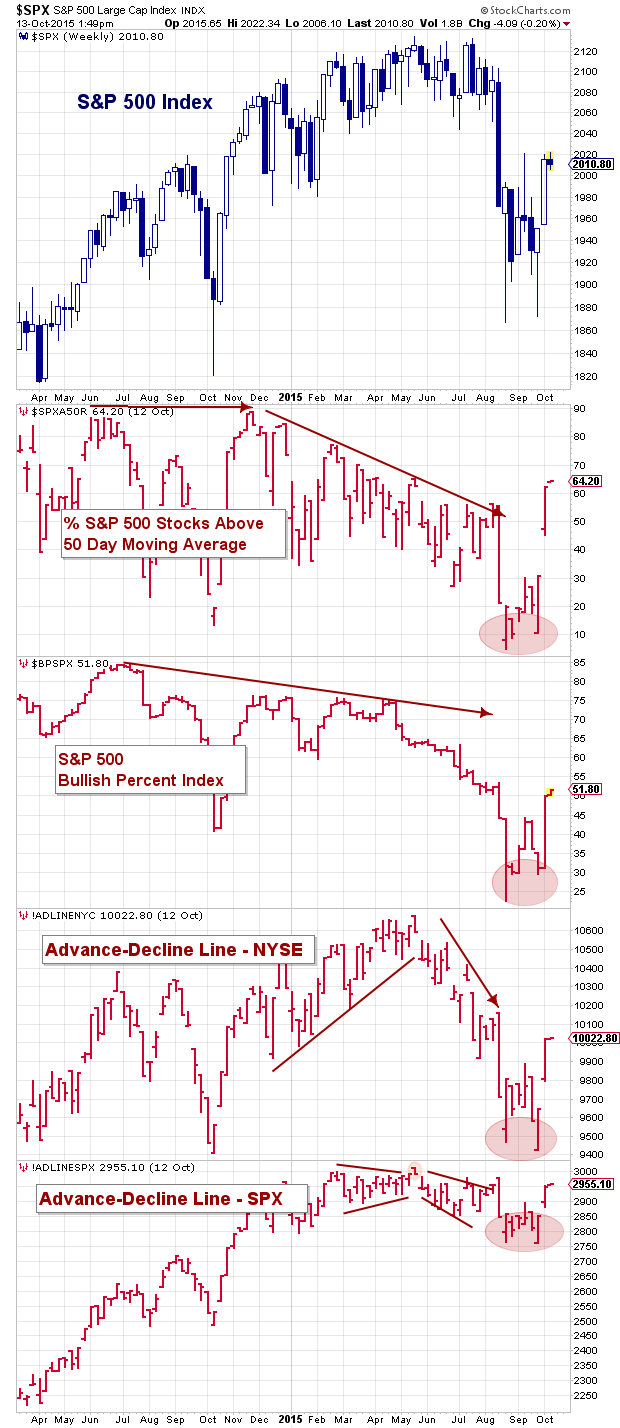
Market Breadth
Lastly, let’s look at market breadth. The chart below employs weekly bars to broaden the time frame. As you can see, several breadth indicators have improved considerably. Although “price” is still in the woods (not out yet), breadth is finding its footing.
Thanks for reading.
Twitter: @andrewnyquist
No position in any of the mentioned securities. Any opinions expressed herein are solely those of the author, and do not in any way represent the views or opinions of any other person or entity.


