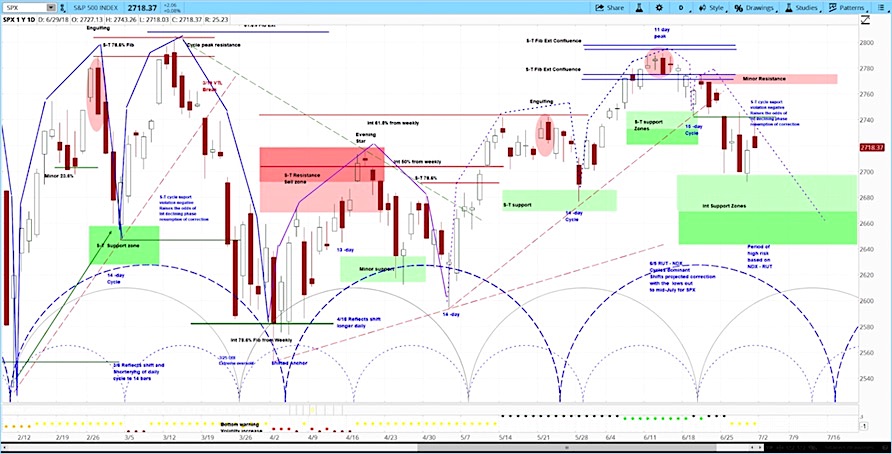
The S&P 500 (NYSEARCA:SPY) was hit by increased volatility last week, closing the week down -1.3%.
Stocks will likely struggle over the next 2 weeks.
S&P 500 Cycle Outlook for the week of July 2, 2018:
1. The S&P 500 was down 1.3% last week, due in part to due to President Trump’s attempt to place restrictions on foreign investment.
2. Crude oil (NYSEARCA:USO) rose another 8% last week, gushing a total of 13% in the last week and half.
3. Amazon (NASDAQ:AMZN) took its next step in its plan to enter the health sector with the acquisition with online pharmacy, PillPack.
Our projection this week in stocks is for the S&P 500 to decline to the 2670 level over the coming two weeks.
The latest askSlim Market Week Video – see additonal commentary below
Trump dabbles with foreign investment policy
Last weekend, news surfaced that the Trump administration was planning to propose new rules for foreign investment in US technology firms. However, on Monday, the administration gave mixed signals, with Treasury Secretary Steve Mnuchin saying it would apply to all firms, and trade policy advisor Peter Navarro saying it would apply only to Chinese firms.
Also factoring in, Harley-Davidson (NYSE:HOG) announced its plans to shift some of its production from the US to Europe in an effort to circumvent the European Union’s plans to impose tariffs on American motorcycles. Their decision was based in part on the high cost of the steel tariffs and the proposed European tariffs. As well, Harley’s European sales are growing by 8%, while its US growth is waning. By the end of the day, the stock market fell 1.4%.
By Wednesday, instead of developing new investment restrictions, Trump had endorsed efforts to pass bipartisan legislation that would strengthen the Committee on Foreign Investment in the United States (CFIUS). While some called this a softening of his stance, this approach has the benefit of not explicitly targeting China, while likely having the same impact.
Crude continues to spurt
Crude oil rose 8% last week, after having already popped 5% the previous week, once OPEC had engineered a convoluted supply increase. As for this week, oil increased 3% on both Tuesday and Wednesday after the Trump administration signaled that it would continue to implement the Iranian economic sanctions. It rose again on Thursday and Friday.
After dropping on Monday, the SPDR S&P Oil & Gas Exploration & Production (XOP) and the Market Vectors Oil Services (OIH) ETFs each increased over 3% for the remainder of the week. In total, oil had gushed 13% in the last week and half. Check out the askSlim Market Week for our analysis of the crude oil futures chart.
Amazon takes next step to enter health sector
On Thursday, Amazon (AMZN) rose over 2% after announcing that it had agreed to pay $1 billion for the privately-held online pharmacy, PillPack. Traditional pharmacies such as Walgreens (WBA), CVS Health (CVS) and Rite Aid (RAD) each fell over 10% on the news. The acquisition is unlikely to have a near-term effect on these pharmacies.
The significance is the “Amazon effect” which occurs after Amazon decides to enter and disrupt a new market. In the case of healthcare, this should be taken together with the announcement a few months ago that Amazon, Berkshire Hathaway (BRK) and JP Morgan Chase (JPM) would form a partnership. While few details have been released, it is expected that the partnership would provide healthcare to each company’s employees.
The relevant issues are not only whether Amazon will be successful in its latest attempt at disruption, but how long it will take and how its rivals will respond. Check out the askSlim Market Week for our analysis of the Walgreens chart.
Our expectation for this week
Last week was action packed, and we expect more to come. However, US trading will likely slow down this week, with a half day on Tuesday and a full holiday on Wednesday in celebration of Independence Day.
In any case, each week we like to clarify our expectations for the stock market and the other markets we watch. Our approach uses technical analysis focused on market cycles to project price action. Given the shortened schedule, we will look ahead for the coming two weeks.
According to the askSlim Stock Index Report, our analysis of the S&P 500 is for stocks to continue their move lower. Using the dotted blue cycle brackets on the chart below, we believe that the SPX is in the declining phase of its current market cycle. It will likely continue this move, with 2670 as a conservative projection. A break below the 2677 level would be a break below where SPX began the cycle. This would be a bearish signal, depending of course on the extent of the breakdown. Check out the askSlim Market Week for a more detailed analysis of the S&P 500 (SPX) chart.
For more from Slim or to learn about cycle analysis, check out the askSlim Market Week show every Friday on our YouTube channel. A link to the latest episode is at the beginning of the article.
Twitter: @askslim
Any opinions expressed herein are solely those of the author, and do not in any way represent the views or opinions of any other person or entity.


