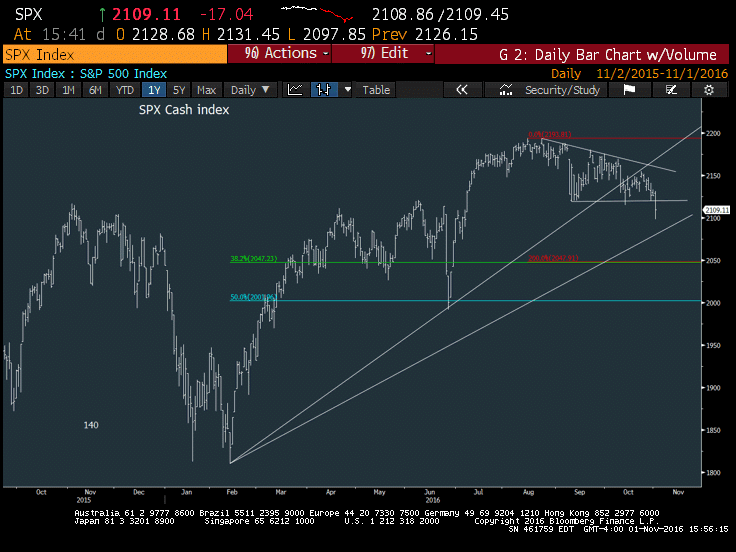
The S&P 500 Index (INDEXSP:.INX) has broken near-term support found at September and October lows. And despite the bounce attempt, additional weakness has set in and looks likely in the days ahead.
Investors should look for initial price support down near 2070 and then 2050 for a dip buying opportunity. Similar to the requirement that all stock indices join the NDX at new highs before confirming the breakout, a similar requirement exists for price breakdowns (i.e. price support violations).
Thus far the S&P 500 is the only one of the major indices which has violated the September lows. While the NASDAQ Composite (INDEXNASDAQ:.IXIC) pullback may require additional consolidation (and is bearish), it’s hard to make anything more than just a short-term case for being negative at this time.
5 Factors suggested we might see this consolidation break to the downside vs upside
1) Small-cap deterioration – This caught the market completely off guard and while many were hoping for small-cap stocks and the Transports to begin pushing higher in mean reversion form to close the gap into year-end, the exact opposite happened when the Russell 2000 violated support.
I wrote about this last week: Investor Concerns Mount As Small Caps Weaken
2) Ongoing market breadth and momentum issues – With only 1/3 of all stocks trading above their 50-day moving average, we saw a far different picture than what the indices would have us believe about stock market indices being healthy trading within 3% of all-time highs. The Advance/Decline line peaked out in September and has just broken down again under Sept/October lows. This was a definite concern.
3) Sector Deterioration – Quite a bit of technical damage has been done with Healthcare and Discretionary (Retail) and recently has been joined by Energy and Industrials, not to mention a stalling out in Technology. So it was difficult to expect that Financials could carry the entire market as more and more sectors had been weakening.
4) Negative Divergence in the stock market indices – The S&P 500 and Dow Jones Industrial Average never joined the NASDAQ 100 in moving back to new highs. This was something that’s important when trying to gauge how strong the US indices were overall. Global market indices also have been largely range-bound similar to the US, so a very different picture than what the NDX had been saying.
5) Defensives have begun to bounce sharply – This action often argues for market weakness. While Utilities and Real estate fell on Tuesday when yields moved back higher, the push into the Defensive sectors looked meaningful in the last week
S&P 500 Chart
Note that the index closed today UNDER 2100 – the chart below is through yesterday and serves the purpose of showing the breakdown. The S&P 500’s price pattern clearly cracked price support at September/October lows, which should pave the way for a test of 2065-70 in the days ahead before seeing any real support. While the trend guiding the S&P 500 from February was broken in October, the 1×1 price/time angle showing 265 days and price from February 10 lows, hits near 2065 and is a more compelling area of support for the S&P 500.
Get more trading insights and market analysis over on my blog Newton Advisor. Thanks for reading.
Twitter: @MarkNewtonCMT
Any opinions expressed herein are solely those of the author, and do not in any way represent the views or opinions of any other person or entity.


