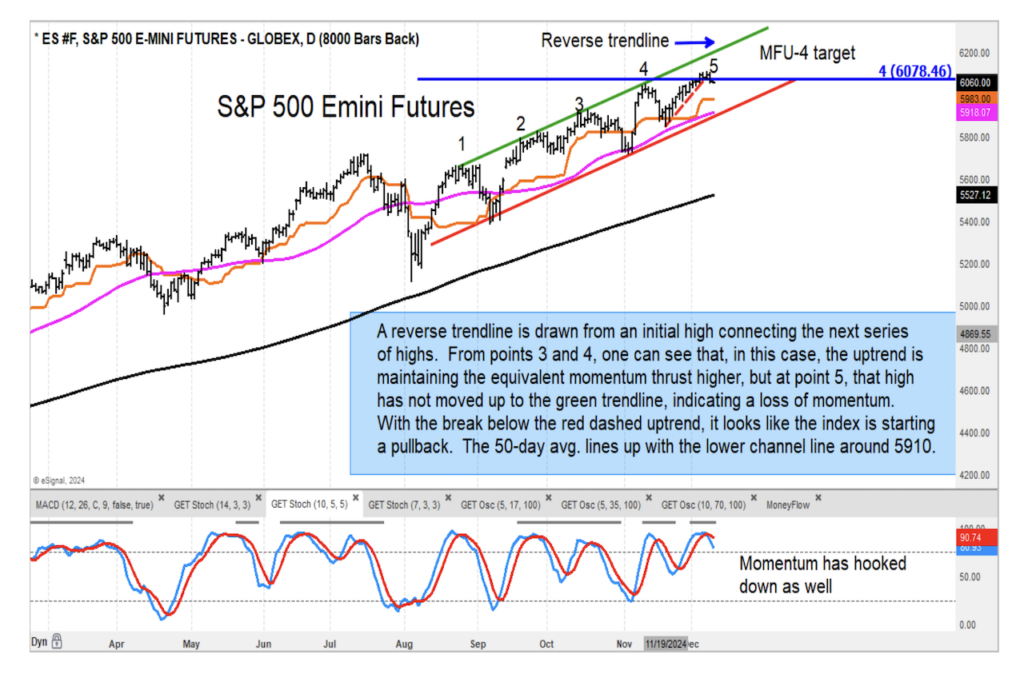
The S&P 500 has shown a loss of upside momentum with its last rally higher off the early November low.
There is still no sign of a topping formation, though, which leads us to believe we could see a sideways range unfolding. See our S&P 500 stock market futures chart below.
The Mid Cap ETF (MDY) and Russell 2000 ETF (IWM) have been pausing from their target zones and are also poised for consolidation.
Our top 3 S&P sector ETFs are XLC, XLF, and XLY.
S&P 500 Index emini futures Chart

Check out my research offerings on Cerundolo Investment Research.
Twitter: @GuyCerundolo
The author or his firm have a position in mentioned securities at the time of publication. Any opinions expressed herein are solely those of the author, and do not in any way represent the views or opinions of any other person or entity.


