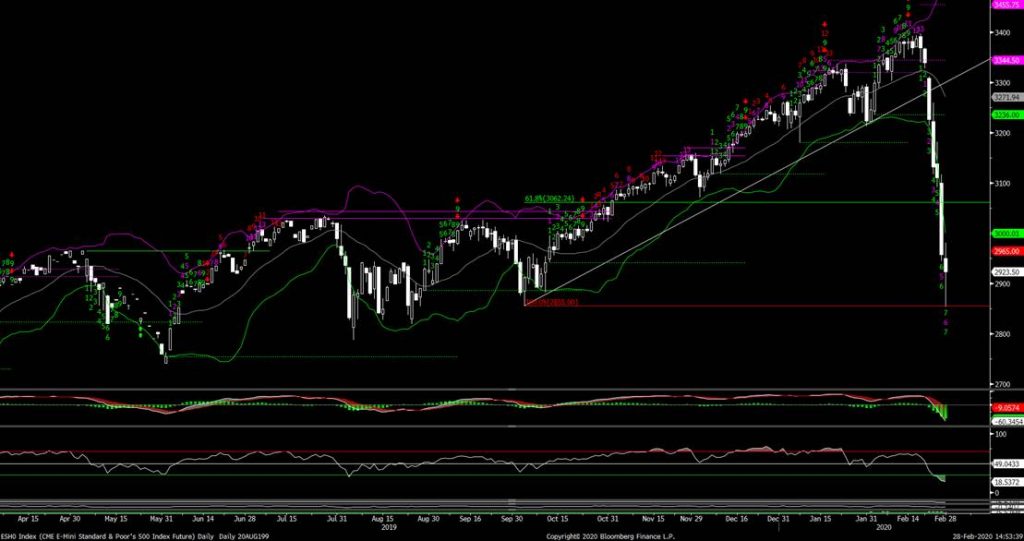
S&P 500 Index “Daily” Chart
The S&P 500 is trading off its intra-day lows, but should move lower to test the lows into Monday and put in a bottom early next week.
That said, the October lows are important as is the price area from August to September.
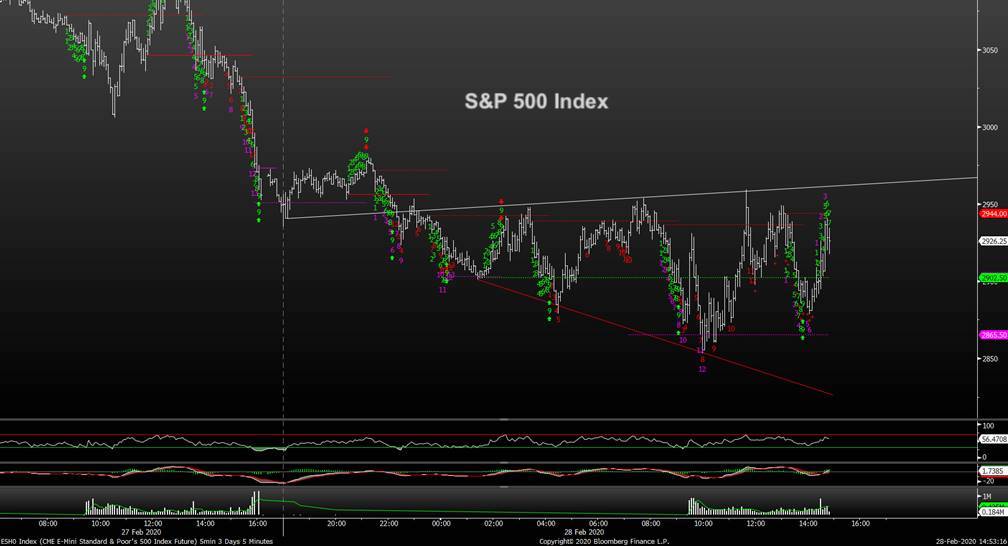
Let’s turn to the “hourly” chart of the S&P 500 Index.
Here we can glean some shorter-term insights (see below).
The “hourly’ chart shows an expanding Diagonal which could lead to a brief move to new lows Monday/Tuesday. But I believe that move lower would be buyable.
Meanwhile, any move back OVER 2959 means this wave lower has already completed and its right to be long.

If you have an interest in seeing timely intra-day market updates on my private twitter feed, please follow @NewtonAdvisors. Also, feel free to send me an email at info@newtonadvisor.com regarding how my Technical work can add alpha to your portfolio management process.
Twitter: @MarkNewtonCMT
Author has positions in mentioned securities at the time of publication. Any opinions expressed herein are solely those of the author, and do not in any way represent the views or opinions of any other person or entity.


