In my past two articles, I focused on the broader stock market indexes – the S&P 500 Index (INDEXSP: .INX) and Dow Industrials (INDEXDJX: .DJI) – and why a clear cut breakout wasn’t likely.
The bullish trend is in place until it isn’t, however, there are signs of divergence, bullish sentiment and exhaustion everywhere.
From my last article (Will Stock Market Bulls Dance Into Another Correction?):
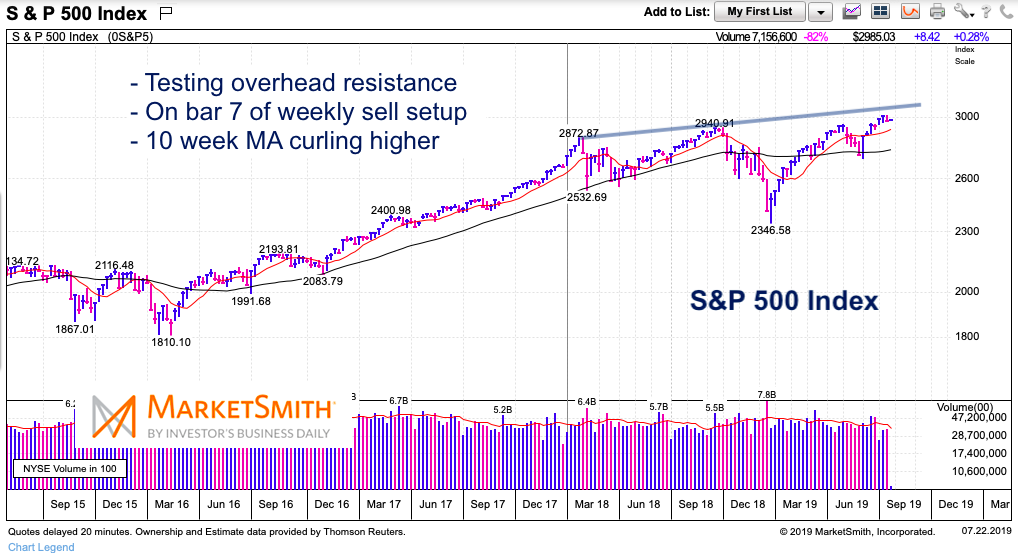
“So, although the structure is bullish, it is still lacking risk-on confirmation. Again, this is from a very macro view. As you know, there is always a bull market somewhere… whether in certain stock indexes, sectors, stocks, or other asset classes… the S&P 500 will have to breakout over rising resistance … That resistance sits around 3050.”
Note that the following MarketSmith charts are built with Investors Business Daily’s product suite.
I am an Investors Business Daily (IBD) partner and promote the use of their products. The entire platform offers a good mix of technical and fundamental data and education.
S&P 500 “weekly” Chart
Not much has changed. The Russell 2000, Dow Transports, and S&P Mid-Caps are still in non-confirmation mode and the Dow Industrials chart looks similar to the S&P 500 – rising overhead resistance about 2 percent higher.
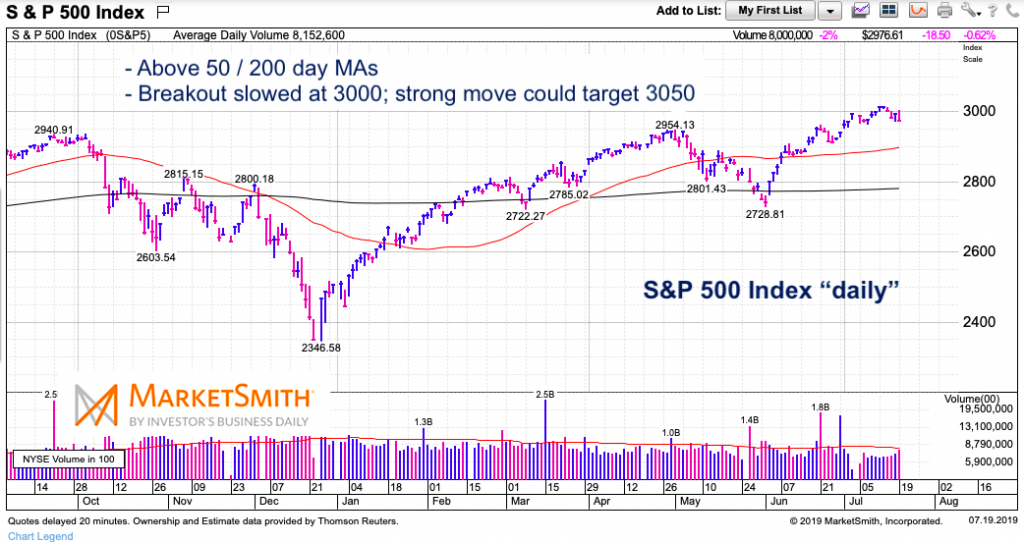
That allows for some upside but the warning signs are there. I took a short position in the Dow Industrials on Friday (via ETF). For the near-term, I’ll remain heavy on cash. My analysis says there’s significantly higher risk to downside than upside over the coming weeks.

S&P 500 “daily” Chart

Twitter: @andrewnyquist
The author may have a position in mentioned securities at the time of publication. Any opinions expressed herein are solely those of the author, and do not in any way represent the views or opinions of any other person or entity.


