The S&P 500 Index reversed lower late last week and is seeing follow through selling this week.
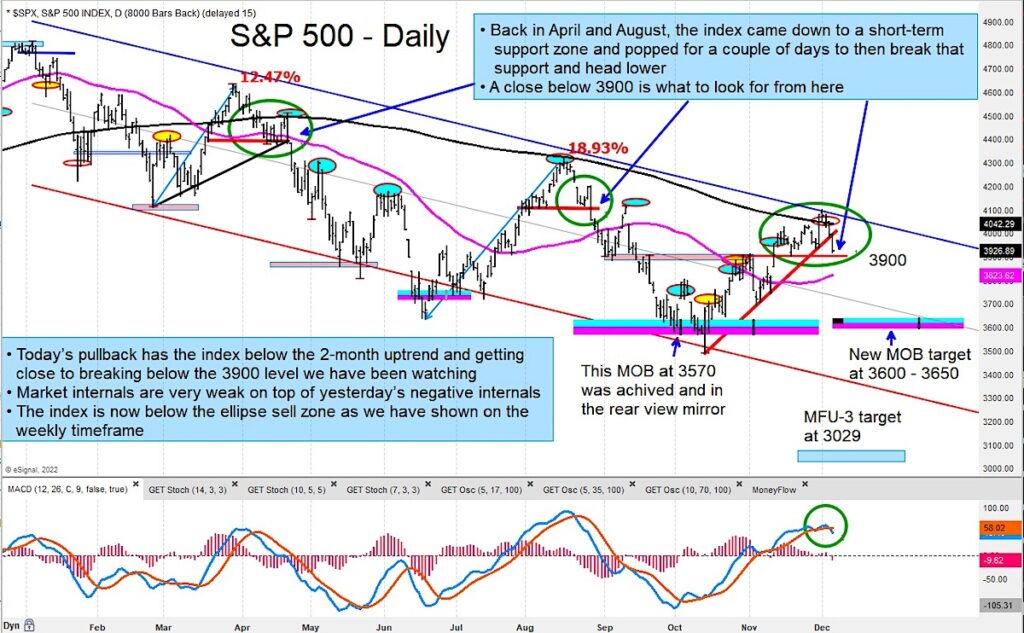
That price reversal is getting deep enough that it is nearing a important support at 3900.
A close under 3900 would trigger a bearish reversal scenario that would likely lead to a much bigger decline. A close below 3900 would open the door to a decline to the 3600-3650 MOB band target on the short-term “daily” chart (first chart below).
S&P 500 Index “daily” Chart

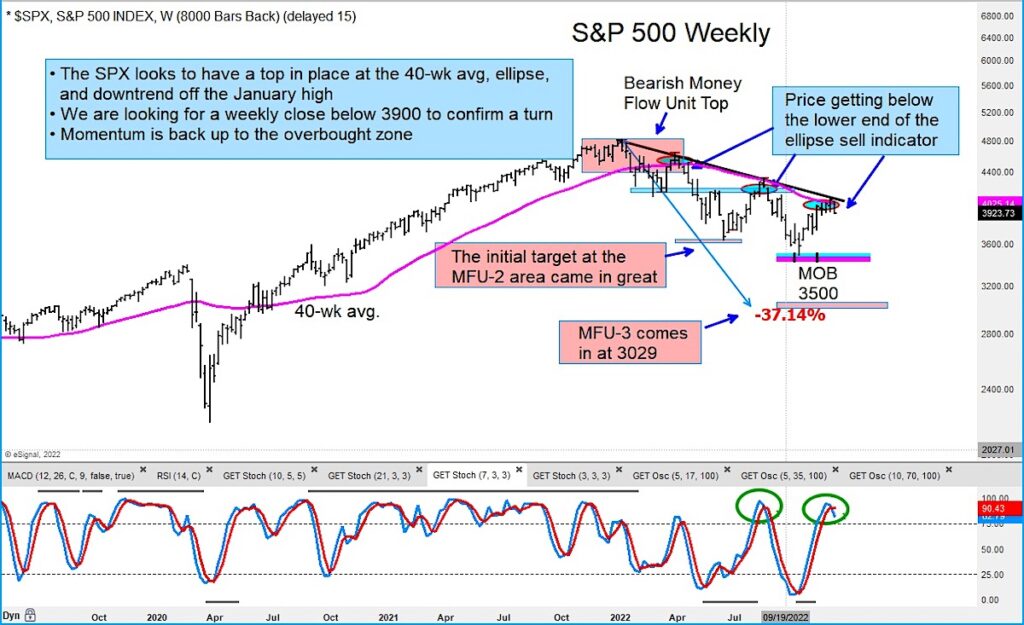
On the “weekly” chart we can see that the reversal is occurring once again at the 40-week moving average. This could lead to even further downside, as our MFU-3 (Money Flow Unit) price target stands at 3029. This target was created a while back and remains as our intermediate term downside target.
S&P 500 Index “weekly” Chart

Twitter: @GuyCerundolo
The author or his firm have a position in mentioned securities at the time of publication. Any opinions expressed herein are solely those of the author, and do not in any way represent the views or opinions of any other person or entity.


