Asked about U.S. equity a portfolio manager recently said, “Why not just buy the S&P 500 and forget about it?” Honestly, it’s a fair question, and at first glance, the logical answer seems to be, “Why not?”
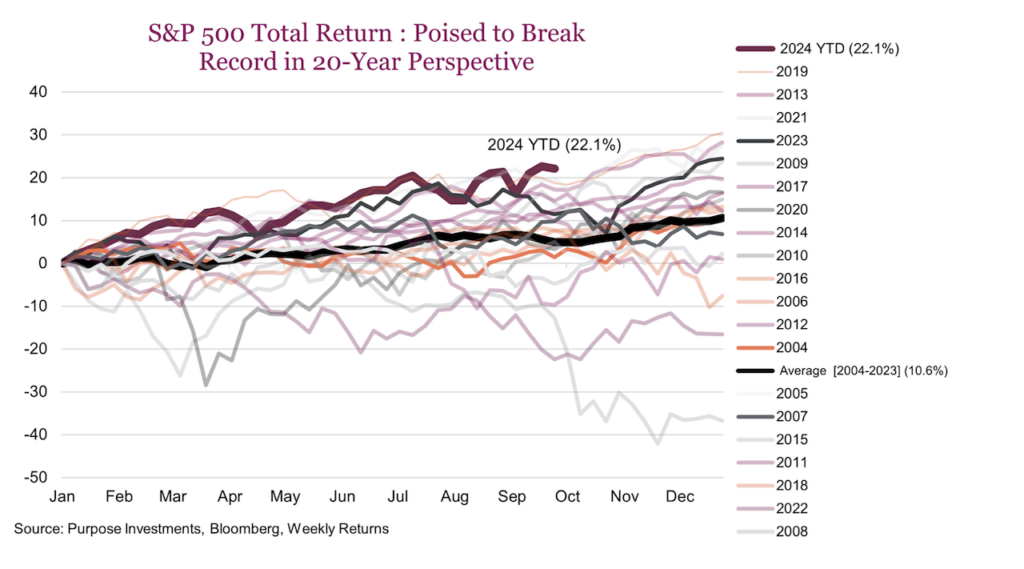
U.S. equities are quietly having one of their best years since the 90s. If you look at the S&P 500’s performance over the past 20 years, not only is this the best year so far through the end of September, but if you look at the top-ranked full calendar years, 2019, 2021, and 2023 all rank in the top four.
Whether it’s been a conscious decision to overweight U.S. equities, or simply the result of market growth and increasing model exposure, it’s no surprise that portfolios are so heavily tilted toward U.S. stocks. Why wouldn’t that be the case when the market keeps rewarding that choice; it hasn’t been a mistake by any means, the S&P 500 total return index is up 64.5% in just two years. Saying that out loud almost sounds ridiculous, but after 45 new highs in 2024, here we are!
Investors seem confident that the market will keep cruising along, but what if it doesn’t? We have seen this happen a few times before. What if an unforeseen market event comes along and the market takes a hit like it did in ’08? That kind of pullback, around 50%, would cause devastation and wreck a lot of retirement plans. While the current environment seems to be flooded with liquidity, there’s no guarantee that dip-buying will always be there to save the day. We may sound like a broken record, but our goal is to continue to bring awareness to underlying portfolio exposures that not all portfolio managers may be aware of.
When looking at your portfolio you may not realize that you are overweight U.S. exposure. Understanding that the baseline may differ from investor to investor, there remains a good probability that the U.S. equities is much higher than you would believe. It’s probably one of two things that caused this: either investors don’t realize how much their exposure has increased or they are aware and are just letting it run with a baseline higher than most.
Either of these scenarios makes sense and even if investors are not aware, it has been the right call for over a decade. After such a long stretch of success, it’s no surprise that investors have grown comfortable. Anchoring bias has led most investors there, focusing on the recent strong runs of the S&P 500 so much that we have forgotten that there have been similar returns found across the globe. Maybe it’s time to rebrand anchoring bias as “comfortability bias.”
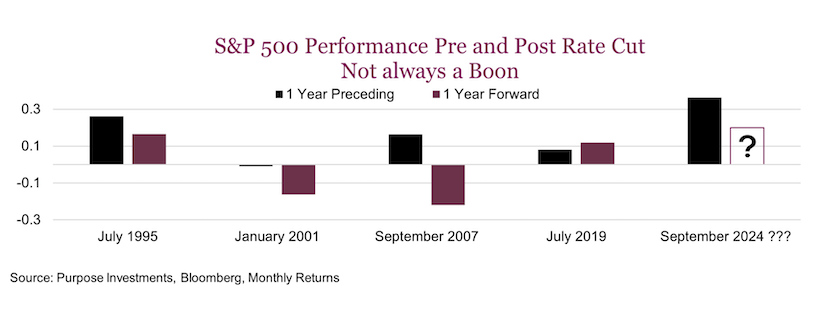
But what about moving forward? The direction of rates in the U.S. economy is known and there’s a lot of hype around rate cuts being a boon for the market, but history shows it’s not that simple. Logical thinking might suggest with lower rates, stocks will do well. Borrowing becomes cheaper and earnings start to improve and over the long run, this is true. But it is much more nuanced in the short term, and understanding why the Fed is cutting has a pretty big impact.
Look at what’s happened to the S&P 500 the last four times the Fed started cutting rates. The year before the cut the market was up three out of four times. The 1-year forward returns show a 50/50 shot of a negative or positive return. This year, we’re seeing the best pre-cut performance in the last five cycles, but what happens next is anyone’s guess. We can expect the effects of these rate cuts will likely play across markets for quite some time. The “Fed playbook” is there, but just like any other playbook sometimes that play gets blown up.
Without having a lot of data to evaluate for rate-cutting cycles, understanding “Why?” for the Fed is important. The Fed’s reasoning behind rate cuts can drive market reactions differently depending on whether it’s seen as a precaution against a recession or a routine policy adjustment. While some of the potential benefits of rate cuts may already be reflected in current stock prices, market volatility is expected due to ongoing uncertainty. Regardless, in any environment, the market’s response will not be very predictable as the Fed navigates these inflection points.
The bottom line is that portfolios are rightly or wrongly loaded up on U.S. stocks, and while that’s been the right call for a while, it’s difficult to say if it will continue to be. As said before, it’s all subjective of what is considered a “neutral” or baseline U.S. allocation. Keep an eye on portfolio weightings, as there are many global opportunities to explore, and diversification remains a key strategy for long-term success. With increasing risks and high valuations, it might be time to rethink those weightings. We advocate for a more balanced approach, with valuations stretched as noted in the previous section, the potential for disappointments is elevated.
Market cycle
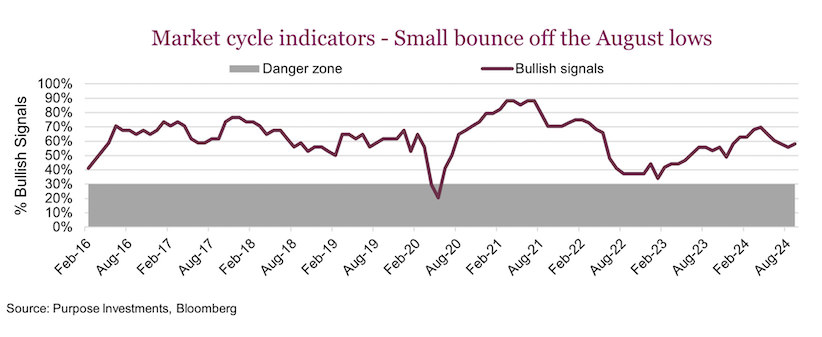
Market cycle indicators eroded for several months, and even dipped further intra-month in September getting very close to crossing below 50 but bouncing back up to finish the month at 58% positive.
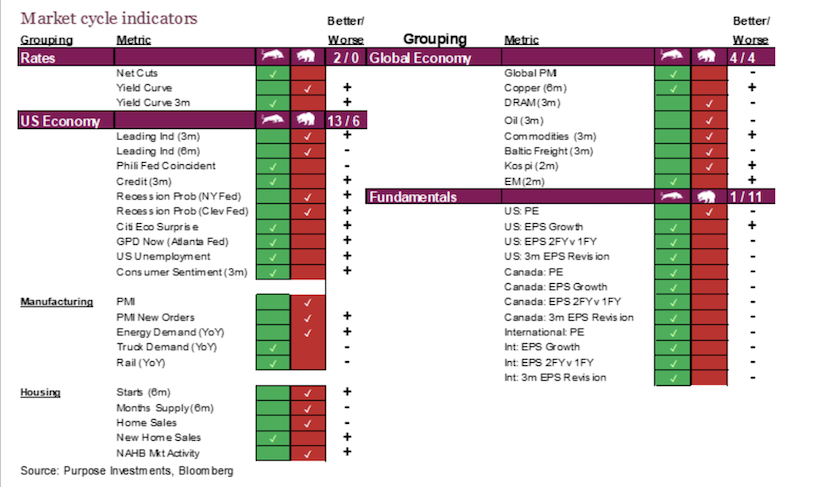
Compared to last month the U.S. economy gained four bullish signals. GDP Now, from the Atlanta Fed, which is an econometric model built around more high-frequency data, increased from 2% at the end of August to 2.5%. Within this measure, it was strengthening export estimates that were the big driver. Other signals that flipped were the Citi Economic Surprise index and Consumer sentiment. Sentiment measures have increased to their highest level since April. Inflation easing would be a big contributor to this as well as lower interest rates. Manufacturing metrics still are moderately weak but beginning to see some positive trends in the PMI data.
Outside the U.S., the Global Economy section gained a bullish signal but also lost one. Resulting in a 50/50 split. DRAM signals flipped to negative, but the Baltic Freight indicator moved into bullish territory. Shipping rates rose to their highest rates in nearly three months thanks in large part to China’s stimulus plans and surging commodity prices. The port shutdown in the U.S. may begin to cause havoc with global shipping and supply chains and this indicator is quite volatile. The KOSPI is still bearish but it, along with a several other indicators, are improving.
Source: Charts are sourced to Bloomberg L.P., Purpose Investments Inc., and Richardson Wealth unless otherwise noted.
Twitter: @ConnectedWealth
The author or his firm may hold positions in mentioned securities. Any opinions expressed herein are solely those of the authors, and do not in any way represent the views or opinions of any other person or entity.


 and Semiconductors (SMH): Concerning Price Pattern?")
 and Semiconductors (SMH): Concerning Price Pattern?")


