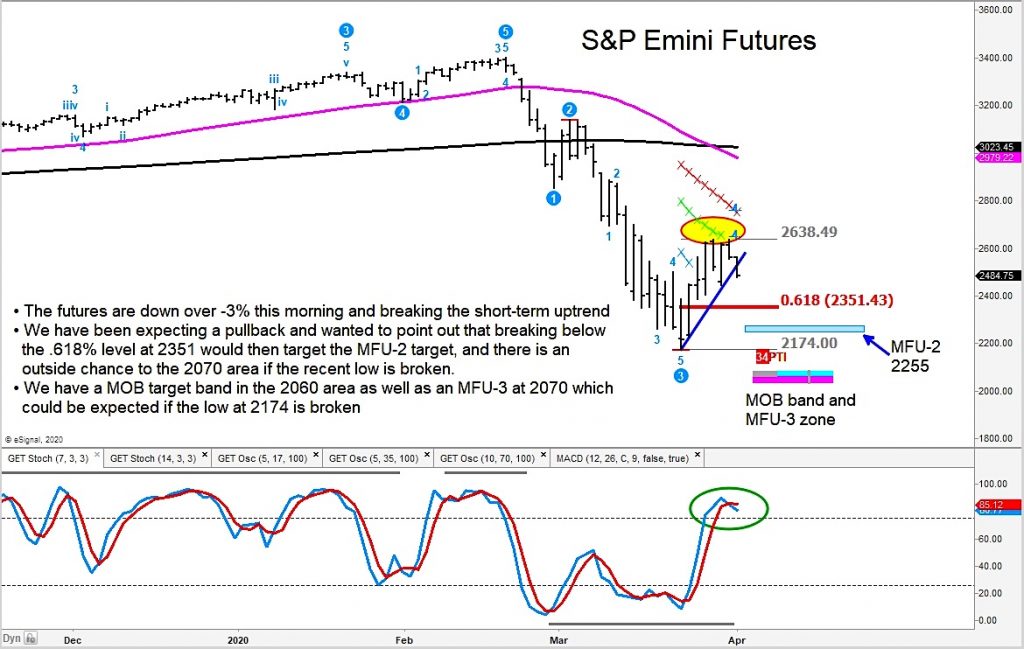
S&P 500 Index Futures Chart
In an article yesterday, I asked “Is It Time To Retest The Lows?“
After a sharp bear market rally that saw the S&P 500 Index stall at initial resistance, I pointed out that a pullback was highly likely. And perhaps a deeper one.
Today I point to an updated chart of S&P 500 futures. It highlights key Fibonacci retracement levels to watch as the rally turns into a pullback.
The 61.8 retracement level is at 2351 on S&P futures. That’s our first key support.
If that level breaks, then we look to support at our MFU-2 target of 2255. A move below that level could target 2060 to 2070 level.
The author may have a position in mentioned securities at the time of publication. Any opinions expressed herein are solely those of the author, and do not in any way represent the views or opinions of any other person or entity.


