I’ve spent the better part of the day looking at charts of the major stock market indices and sectors.
Today I analyze one of the major stock market indices, the S&P 500 Index.
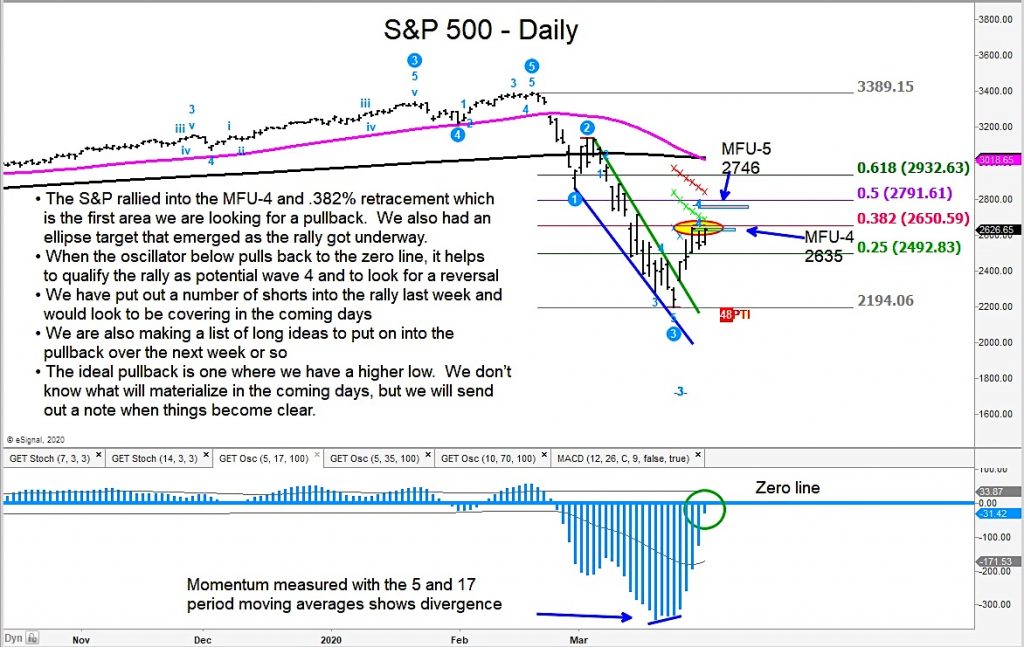
It appears that the broader stock market is preparing for a pullback and potential “retest” of the March lows.
As you can see, the S&P 500 Index hit our first target zone (MFU-4 target and 38.2 Fibonacci level), where the probabilities for a pullback have increased.
That may be playing out now. We provided a list of short ideas to clients for the pullback and will soon work on a list of long ideas as well.
Hedges and raising cash into this rally seem appropriate for professionals that are “active” in the market.
S&P 500 Index Chart

The author may have a position in mentioned securities at the time of publication. Any opinions expressed herein are solely those of the author, and do not in any way represent the views or opinions of any other person or entity.


