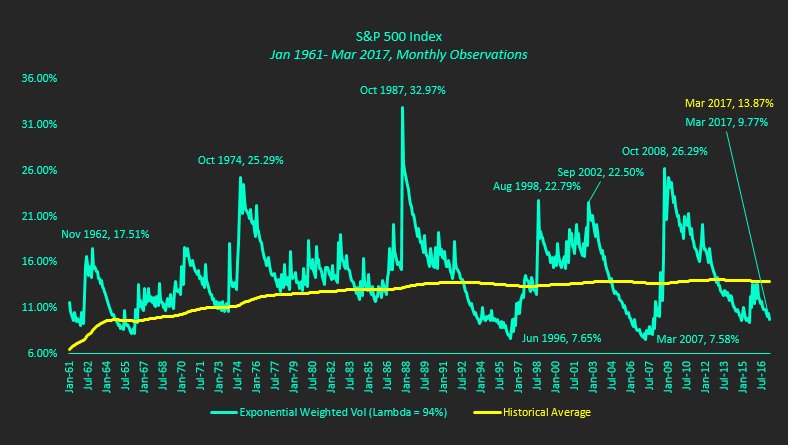
Realized volatility on the S&P 500 Index (INDEXSP:.INX) is approaching historically low levels; similar levels that were achieved in June 1996 and March 2007.
Both of these periods saw realized volatility jump roughly 3 times higher in a relatively-short-time-period.
So the million dollar question: Is it different this time?
Here are some bullet points about the chart shown below and the calculation used:
- The calculation of Exponential Weighted Volatility weights the volatility observations, with the most recent observation receiving the most weight. The standard volatility calculation gives equal weight to all observations, regardless of when they occurred.
- Lambda determines the weighting received. The most recent observation’s weighting equals (1-Lambda), or 6% in this example. Each successive weight is 94% of the previous weighting. In this example, the next weighting equals Lambda*6%, or 5.64%.
Check out more of my research over at Global Technical Analysis. Thanks for reading.
ALSO READ: Why The Market’s Optimism Is Misplaced
Twitter: @Techs_Global
Any opinions expressed herein are solely those of the author, and do not in any way represent the views or opinions of any other person or entity. The author doesn’t not have a position in the mentioned securities at the time of publication.


