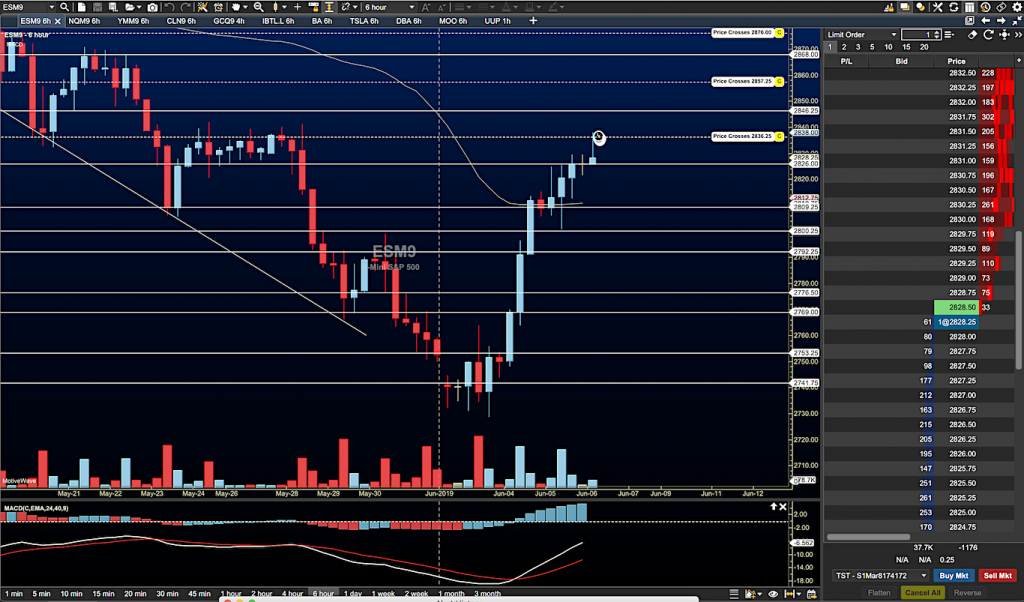
S&P 500 Futures Trading Chart
In a reflection of yesterday’s estimations, the statistic that suggests a bit higher press before a fade seems to be right on line with what charts are doing.
S&P 500 futures are holding higher lows after a choppy day that held the line and then we have seen further presses higher.
We are watching the ‘strong hand’ of enthusiasm and keeping the long countertrend push higher in the markets. Mentally, many of us realize that news chatter and hope for the Fed to lower rates is closer. It becomes a wait state as the FOMC needs to have DATA to drive the desire to lower rates.
Tech continues to be weak relative to the other markets as it recovers – the NASDAQ Futures $NQ_F remains vulnerable below 7315. We sit at prominent lower highs for the indices we watch as we did yesterday, stretching a bit higher into the levels near the midlines of higher congestion but could easily press higher before fading.
TAKEAWAY – Bullish bounce in an intermediate bearish trend signal tells us that for the moment as long as we hold higher supports, we will either stay in the range or head higher. Employment numbers are tomorrow.
The backdrop of global slowdown still prevails.
RECAP – S&P 500 futures $ES_F buyers now stronger above 2846.75 but face resistance to 2873. The midline near 2853 is the battleground in the $ES_F – for the $NQ_F this midline number is 7315.
Sellers want to move us below 2803 but are willing to wait it out and stage the fade near 2853. This is the current battle and could be a coin toss in terms of direction. Be alert
Twitter: @AnneMarieTrades
The author trades stock market futures every day and may have a position in mentioned securities at the time of publication. Any opinions expressed herein are solely those of the author, and do not in any way represent the views or opinions of any other person or entity.


