Broad Stock Market Futures Outlook for May 14, 2018
Charts remain in bullish formations holding higher support but a series of measured moves across indices suggest that we are at a resistance zone that could easily bring fades to deep support.
If you are looking for good swing setups, it seems more prudent to allow these charts to come into support in big time frames to minimize risk.
S&P 500 Futures
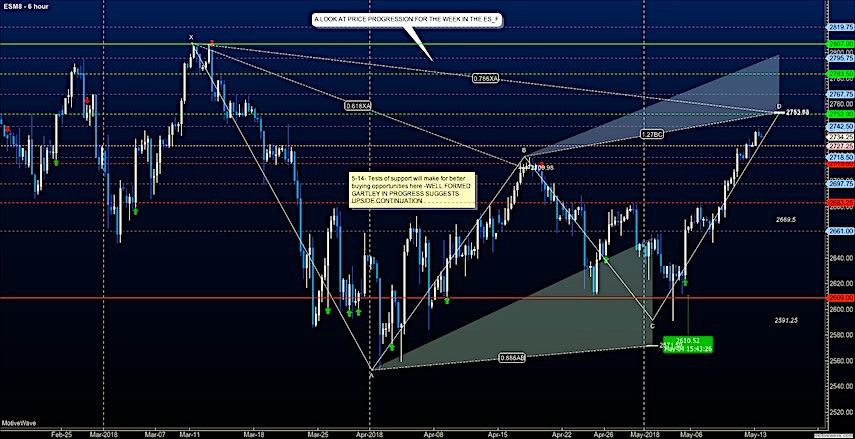
Moves on Friday took us into familiar resistance of the past month – this is where we need to hold particular attention to the potential failure to break higher here for a signal that the chart will test support below at congestion and hold bullish formations. Holding above support above 2713 today is important for another day. Deeper retracements are likely if we lose 2702 – but fades are still likely to bring buyers out for now. The bullets below represent the likely shift of trading momentum at the successful or failed retests at the levels noted.
- Buying pressure intraday will likely strengthen with a bullish retest of 2734.75
- Selling pressure intraday will likely strengthen with a bearish retest of 2726.75
- Resistance sits near 2734.5 to 2742.25, with 2752.75 and 2770.5 above that.
- Support sits between 2727 and 2718.75, with 2708.5 and 2696.50
NASDAQ Futures
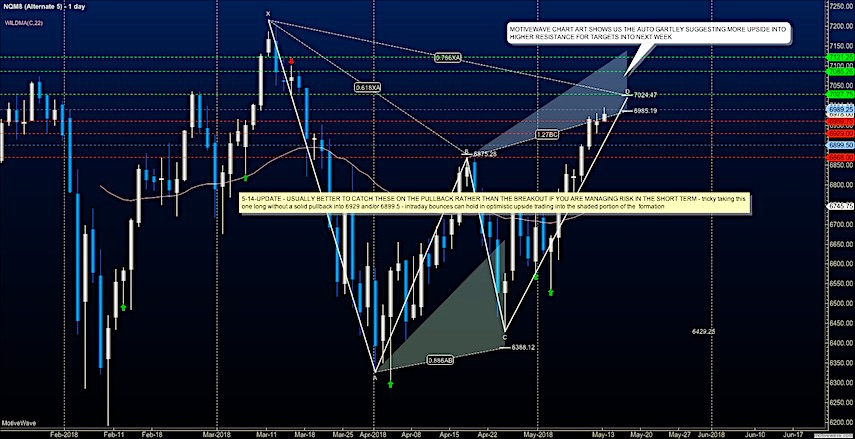
Sellers kept us from breaching 6989 but higher lows prevail suggesting we will bounce at support zones first near 6959, then near 6934. Pullbacks still show buyers will support us below but dips may be deeper depending on the strength of buyers holding that our measures of support. Volume profiles give us a strong chance of fades into these low auction spaces. The bullets below represent the likely shift of trading momentum at the successful or failed retests at the levels noted.
- Buying pressure intraday will likely strengthen with a bullish retest of 6987.75
- Selling pressure intraday will likely strengthen with a bearish retest of 6950.5
- Resistance sits near 6987.25 to 6994.5 with 7011.75 and 7026.75 above that.
- Support sits between 6971.5 and 6952.5, with 6932.75 and 6896.5 below that.
WTI Crude Oil
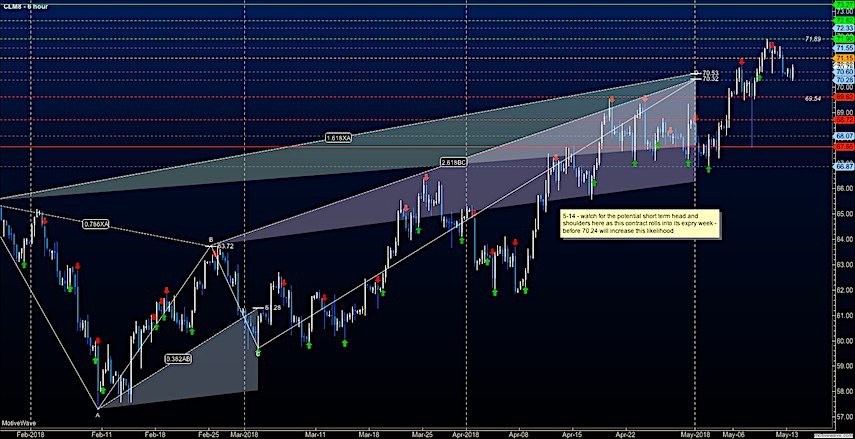
Slowing of price action continues as we step into the expiration week of the current contract – The levels near 71.15 now stand as resistance. Below 70.28, sellers will likely become more aggressive. The bullets below represent the likely shift of trading momentum at the successful or failed retests at the levels noted.
- Buying pressure intraday will likely strengthen with a bullish retest of 71.15
- Selling pressure intraday will strengthen with a bearish retest of 70.28
- Resistance sits near 70.8 to 71.14, with 71.46 and 71.86 above that.
- Support holds near 70.44 to 70.28, with 69.87 and 68.86 below that.
Twitter: @AnneMarieTrades
The author trades stock market futures every day and may have a position in mentioned securities at the time of publication. Any opinions expressed herein are solely those of the author, and do not in any way represent the views or opinions of any other person or entity.


