Stock Market Futures Trading Considerations For Nov 15, 2017
The S&P 500 (INDEXSP:.INX) is trading lower on Wednesday morning as bears try to wrestle control of the tape. Bulls bought the dip for the past two days, but can they defend support levels once more. Or will stocks see a deeper pullback. Check out my futures trading commentary below.
Note that you can access today’s economic calendar with a full rundown of releases.
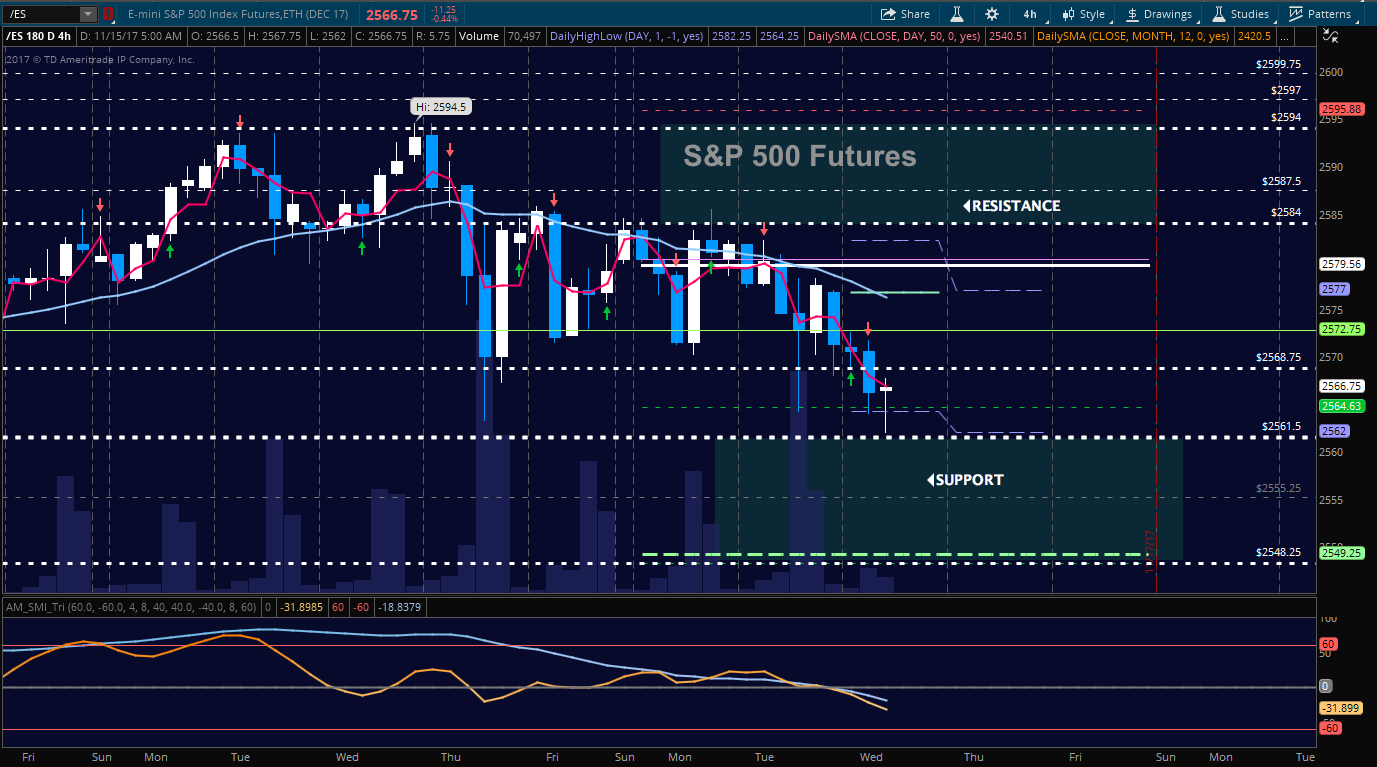
S&P 500 Futures
Charts dip to the edge of support before buyers began attempting the hold at lower support noted near 2562. As in the prior days this week, buying opportunities still lie at the tests of deeper support for long entries and bounces will still deliver opportunities for shorting action to hold into this deeper support. Patience is key here as dips could be lower and bounces could be higher than initially expected. The failure to recapture 2582 is now likely to suggest more downside in a grinding motion into 2548.25. The bullets below represent the likely shift of trading momentum at the positive or failed retests at the levels noted.
- Buying pressure intraday will likely strengthen above a positive retest of 2582.25
- Selling pressure intraday will likely strengthen with a failed retest of 2561
- Resistance sits near 2580.75 to 2582.25, with 2585.75 and 2594.5 above that.
- Support holds between 2562.25 and 2558.75, with 2555.25 and 2548.25 below that.
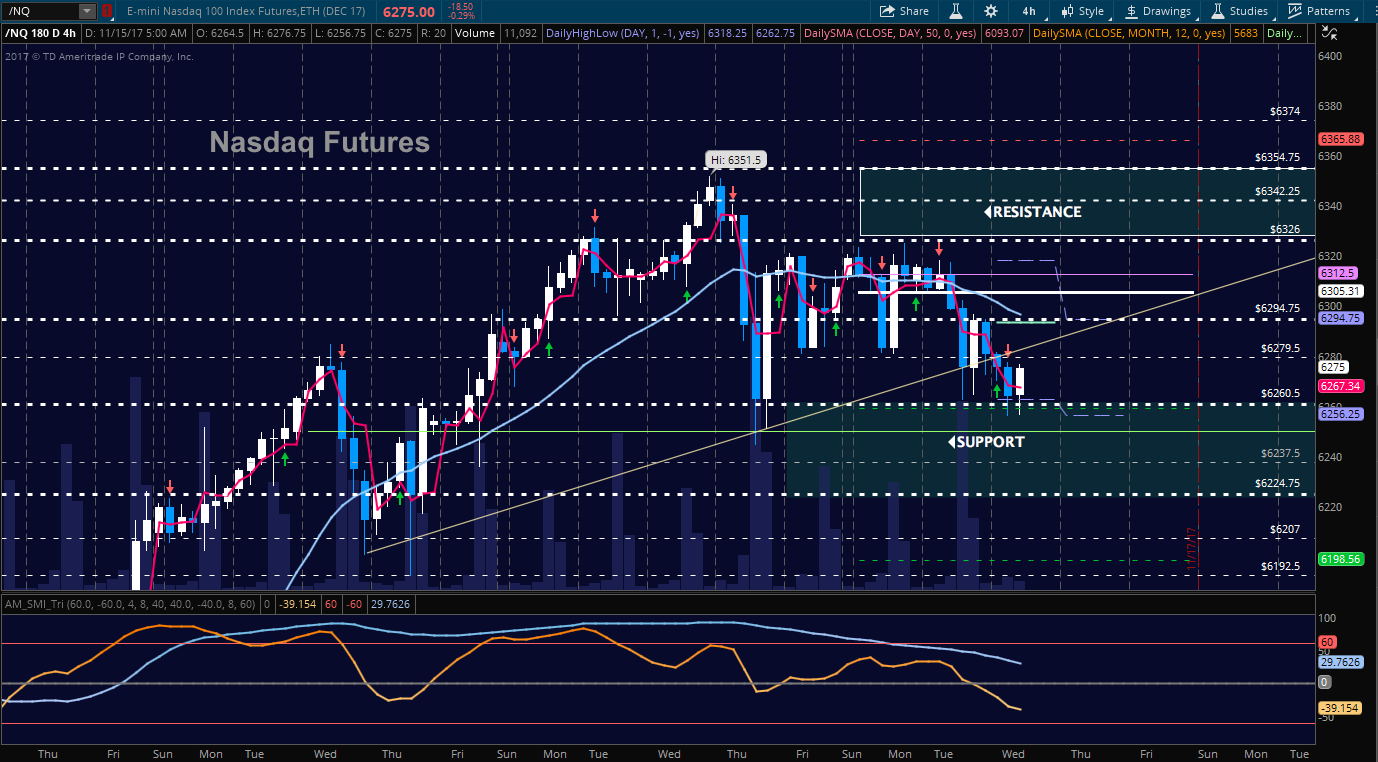
NASDAQ Futures
Traders are still more optimistic in this index than in the others with a hold of important support near 6260. LOWER HIGHS are continuing – meaning selling are preventing buyers from accelerating past resistance. Buyers will have more control above the region near 6316.25 and sellers will have more control below 6305. Resistance remains solid near 6325. Charts are certainly weaker from a recovery standpoint. The bullets below represent the likely shift of intraday trading momentum at the positive or failed tests at the levels noted.
- Buying pressure intraday will likely strengthen with a positive retest of 6294.75
- Selling pressure intraday will likely strengthen with a failed retest of 6256.5
- Resistance sits near 6281.75 to 6294.75.25 with 6316.5 and 6325.75 above that.
- Support holds between 6260.5 and 6245.5, with 6224.5 and 6207.5 below that.
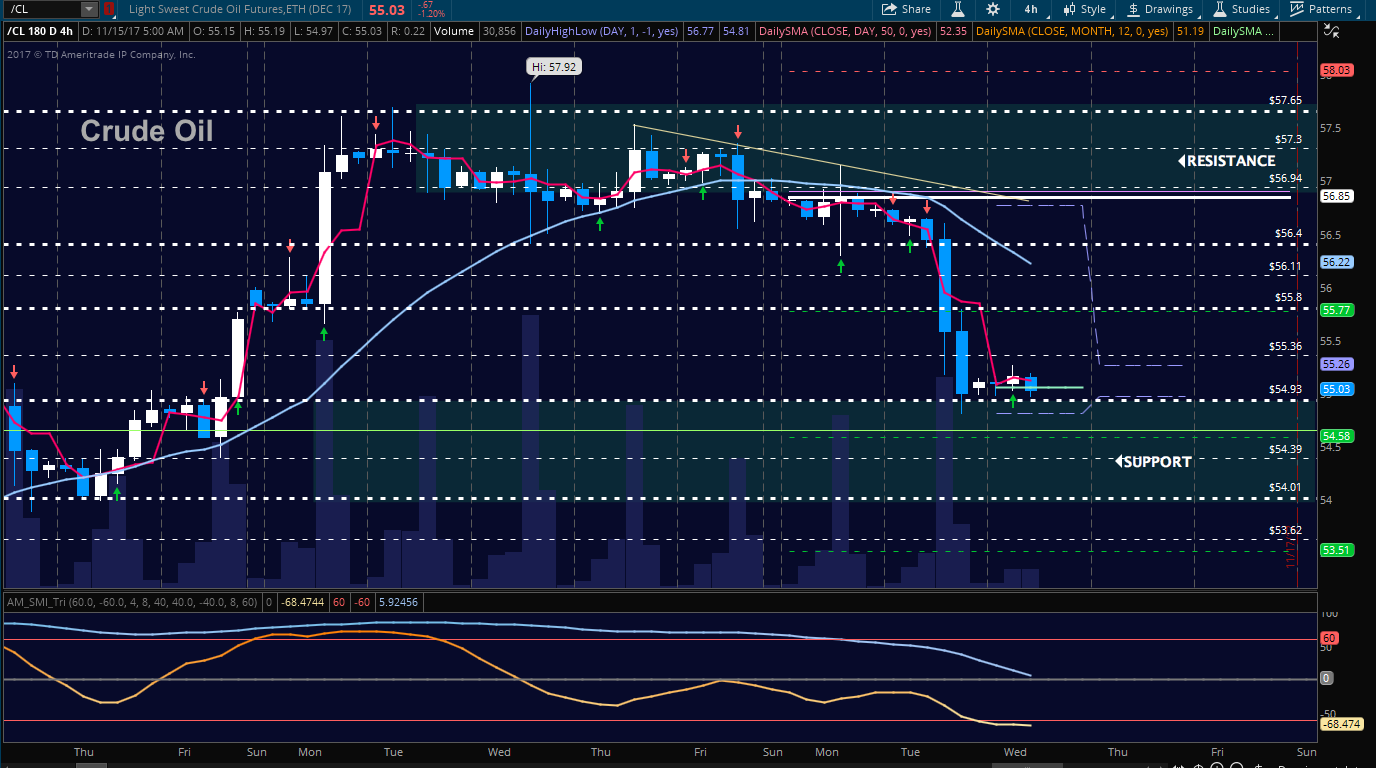
WTI Crude Oil
Oil continued its fade after a significant build of long positions by hedge funds in a profit taking move back into breakout regions near 54.85. Traders should be able to stabilize price near this support region, else we could see 52.7 before the chart settles into clear support. The EIA report is ahead today. The bullets below represent the likely shift of trading momentum at the positive or failed tests at the levels noted.
- Buying pressure intraday will likely strengthen with a positive retest of 55.84
- Selling pressure intraday will strengthen with a failed retest of 54.70
- Resistance sits near 55.36 to 55.8, with 56.23 and 56.85 above that.
- Support holds between 54.85 to 54.58, with 54.39 and 53.65 below that.
If you’re interested in the live trading room, it is now primarily stock market futures content, though we do track heavily traded stocks and their likely daily trajectories as well – we begin at 9am with a morning report and likely chart movements along with trade setups for the day.
As long as the trader keeps himself aware of support and resistance levels, risk can be very adequately managed to play in either direction as bottom picking remains a behavior pattern that is developing with value buyers and speculative traders.
Twitter: @AnneMarieTrades
The author trades stock market futures every day and may have a position in mentioned securities at the time of publication. Any opinions expressed herein are solely those of the author, and do not in any way represent the views or opinions of any other person or entity.


