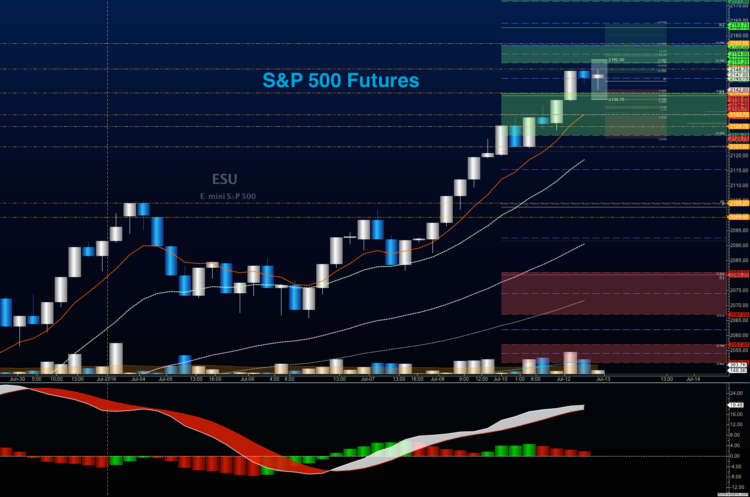
Stock Market Futures Outlook for July 13, 2016 – With a strong trend in place, the thought of shallow pullbacks as buy zones are lulling traders into the ‘buy the dip’ mindset. It is under this backdrop that a technical divergence continues to form beneath the price action on S&P 500 futures and other indices.
But, the charts will still be governed by buyers. I’ll be watching the shallow pullbacks for buying opportunities, while keeping alert for the potential of a lower high to set in. The moving averages across the board show trending formations, so betting against buyers is still risky business at this time. The behavior around the price support area between 2139 and 2141 will be key. Price resistance is near 2150-2153, but range expansion could take S&P 500 futures to 2157.5 if buyers keep the press going. That equates to roughly 2163 on the S&P 500 Index (INDEXSP:.INX).
See today’s economic calendar with a rundown of releases.
RANGE OF TODAY’S MOTION
E-mini S&P Futures
S&P 500 Futures Trading Outlook for July 13
Upside trades on S&P 500 futures – Favorable setups sit on the positive retest of 2145.75, or a positive retest of the bounce off 2141.5 with positive momentum. Keep an eye out for lower highs to set in, as this could signal that sellers are collecting strength. I use the 30min to 1hr chart for the breach and retest mechanic. Targets from 2141.5 are 2143.5, 2145.75, 2147.25, 2149.25, 2151.75, 2153.5, and if we expand, we are likely to stretch above into 2157.5.
Downside trades on S&P 500 futures – Favorable setups sit below the failed retest of 2141 or at the first failed retest of 2150 with negative divergence. As this is a countertrend trade, make sure that you keep your eyes on the lookout for higher lows developing intraday. Retracement into lower levels from 2150 gives us the targets 2147.75, 2145.75, 2143, 2141.75, 2138.75, 2136.5, 2134.5, 2128.25, 2124.5, 2122.75, 2120, 2118.75, 2115.75, 2112.75, 2110.5, and 2107.75 to 2104.5, if sellers take over.
Have a look at the Fibonacci levels marked in the blog for more targets.
Nasdaq Futures (NQ_F)
Nasdaq futures are also exhibiting the double top test formation present on the ES_F (and visible on smaller time frames). Price support levels to watch on NQ_F – 4560.5, and a lower test near 4553. Price resistance sits in a space between 4580.75 and 4592.75.
Upside trades on Nasdaq futures – Favorable setups sit on the positive retest of 4576.75, or a positive retest of 4571.5 with positive momentum. I use the 30min to 1hr chart for the breach and retest mechanic. Watch for the lower high to develop near 4575, if sellers exercise more power intraday. Targets from 4571.5 are 4574.75, 4576.5, 4579, 4581.75, 4584.5, 4587, and 4590.75 to 4592.25, if buyers overpower sellers.
Downside trades on Nasdaq futures – Favorable setups sit below the failed retest of 4568, or at the failed retest of 4579 with negative divergence. Watch those moving averages and trend lines when taking the shorts. It is very countertrend here. Retracement into lower levels from 4579 gives us the targets 4574.5, 4571.5, 4568.25, 4566.5, 4563.75, 4561.5, 4557, 4552.5, 4546.5, 4542.75, 4540, 4538.25, and 4532 to 4528.75, if sellers resume control.
Crude Oil
The API reported a small build of 2.2 after the close yesterday. Today’s EIA report will fuel the chart action from there. A smaller build or draw will bump crude oil up and a bigger build will push the chart down. The price action seems very flexible here, so swings are likely. Old price resistance is once again vying for support at 46.15. Momentum is mixed here; hence the call for flexibility in motion.
The trading range on crude oil today appear to be 43.78 to 46.89 – but volatility continues to reign- meaning, we could see stretches outside these regions easily. Price action is likely to collapse back into the range, if it expands. I suspect we start seeing builds again, as production has ramped up overseas once more.
Upside trades on crude oil can be staged on the positive retest of 46.2, or at a bounce off 45.44 with positive momentum. I often use the 30min to 1hr chart for the breach and retest mechanic. Targets from 45.44 are 45.63, 45.74, 45.98, 46.16, 46.34, 46.48, 46.6, 46.9, 47.04, 47.32, 47.56, 47.74, and 48.14; if traders try once again to recapture 48.
Downside trades on crude oil can be staged on the failed retest of 45.2, or at the failed retest of 46.54 with negative divergence. Targets from 46.54 are 46.35, 46.24, 46.14, 45.94, 45.78, 45.58, 45.32, 44.89, 44.67, 44.48, 44.29, 44.02, 43.84, and 43.65, if selling really takes hold.
If you’re interested in the live trading room, it is now primarily stock market futures content, though we do track heavily traded stocks and their likely daily trajectories as well – we begin at 9am with a morning report and likely chart movements along with trade setups for the day.
As long as the trader keeps himself aware of support and resistance levels, risk can be very adequately managed to play in either direction as bottom picking remains a behavior pattern that is developing with value buyers and speculative traders.
Twitter: @AnneMarieTrades
The author trades stock market futures every day and may have a position in mentioned securities at the time of publication. Any opinions expressed herein are solely those of the author, and do not in any way represent the views or opinions of any other person or entity.


