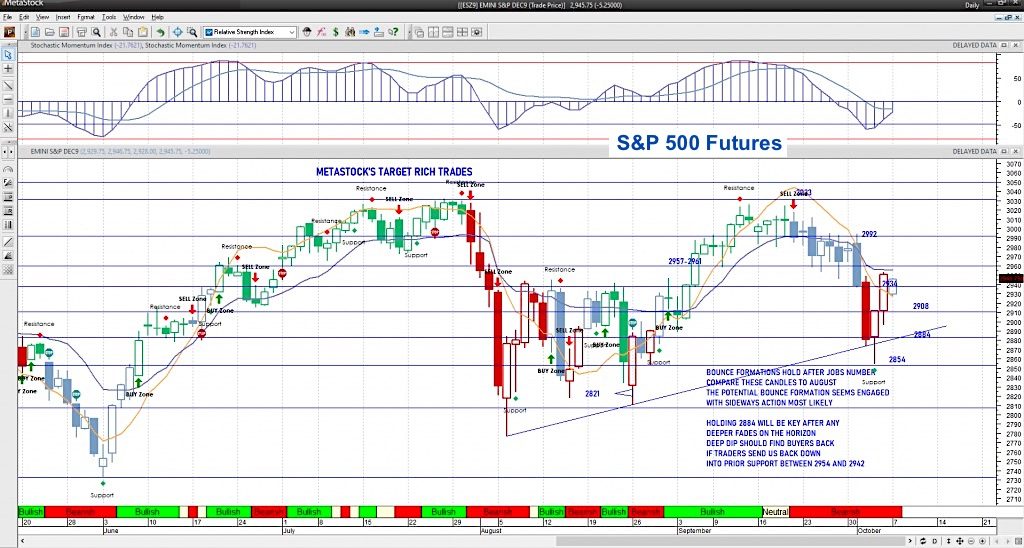
S&P 500 Futures Trading Price Chart Analysis – October 7
MARKET COMMENTARY
Jerome Powell speaks today through Wednesday. Selling pressure is diminishing as we approach resistance – the level we saw as ISM manufacturing numbers were released.
That could change once we get there and bring sellers back to the party.
News of layoffs begin across the board and this should keep a lid on new highs.
WEEKLY PRICE ACTION
Looking closer at S&P 500 futures, I see neutral to positive action, and flattening to negative momentum are now present. Indices are coming into the top of the volatility boxes. This makes for a messy patch of trading.
We closed above 2877 – creating a mixed environment but overall more bullish than bearish. Holding 2972 will be more bullish on a weekly close. Those two levels give us the range for the week, in my mind. All that said, we move clearly into the wide range in all the indices we watch.
COMMODITY & CURRENCY WATCH
Gold prices still holding the bounce above 1504 making it new support once more. Deep pullbacks remain active buy zones – short positioning will require careful attention. The US dollar has lost 99 but should grind to 100, with deep dips finding buyers. WTI is and has been battling the 53.40 support area for weeks of global slowing continue. Failure to close the week above 54 will be quite bearish- deep support zone near 51.40 which was broken and quickly recovered.
TRADING VIEW & ACTION PLAN
Buyers are struggling near 2946. Deep pullbacks are the best places to engage if risk exposure is your primary concern and you are considering long action. Mixed undercurrents exist so range trades are the best. Realize that we could bounce higher than anticipated and fade deeper than anticipated before returning to the range.
Follow the trend in the shorter time frames and watch the price action. The theme of motion is NEGATIVE AS LONG AS WE HOLD BELOW 2901ish today -and POSITIVE AS LONG AS WE HOLD ABOVE 2948ish today. Do what’s working and watch for weakness of trend. Please log in for the definitive levels of engagement today.
METASTOCK SWING SHORT – swing shorts engage for tests of 2878 to 2882.
METASTOCK SWING LONG – inactive
Intraday LONG trading from support edges like the VWAP or solid moving averages will give you the least risk event for engaging. Intraday SHORT trading from resistance edges like the old highs will give you the least risk event for engaging. Follow the candle trend until candles stop breaking higher.
Twitter: @AnneMarieTrades
The author trades stock market futures every day and may have a position in mentioned securities at the time of publication. Any opinions expressed herein are solely those of the author, and do not in any way represent the views or opinions of any other person or entity.


