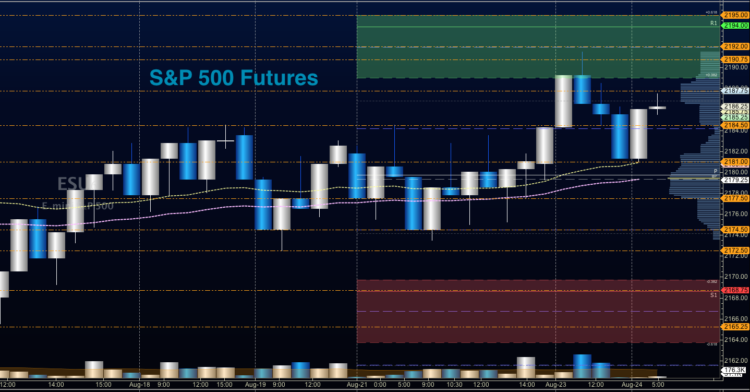
S&P 500 Futures Trading Outlook for August 24, 2016 –
As with yesterday, the morning finds us just above congestion at 2186 on S&P 500 futures. Charts continue their bullish slant but under damp momentum. A breach above 2187.75 may only take us to the top of the range near 2190.75. Range bound motion remains most likely for the S&P 500 (INDEXSP:.INX). Primary price support on S&P 500 futures is at 2181 intraday, with 2179.25, 2177.75, and 2173.25 below that. Price resistance sits near 2188, but could stretch into 2191 and 2194.50, if traders try to break out to the upside. There is no impetus to hold the breakout with so many unknown factors. Traders are simply waiting for news to pave the way forward.
See today’s economic calendar with a rundown of releases.
RANGE OF TODAY’S MOTION
S&P 500 Futures Trading Outlook For August 24 – ES_F Trading Chart
Upside trades for S&P 500 Futures trading – Favorable setups sit on the positive retest of 2187.75, or a positive retest of the bounce off 2179.5 with upward momentum. If we spike downward into 2174.5, it should prove out as a bounce zone, as well. I use the 30min to 1hr chart for the breach and retest mechanic. Targets from 2179.5 are 2181.75, 2184.5, 2187.5, 2189.25, 2191.5, 2194.5, and if we expand, we may stretch above into 2197.75 and 2199.75.
Downside trades for S&P 500 futures trading – Favorable setups sit below the failed retest of 2180.5, or at the failed retest of 2186.5 with negative divergence. Keep your eyes on the lookout for higher lows developing intraday. Retracement into lower levels from 2186.5 gives us the targets 2184.25, 2181, 2177.5, 2174.5, 2172.5, 2168.5, 2165.25, 2162, 2158.5, and 2154.75, if sellers take over. Breakdowns that hold seem very unlikely in this environment.
If you’re interested in watching these trades go live, join us in the live trading room from 9am to 11:30am each trading day.
Nasdaq Futures
The NQ_F sits at the upper edge of congestion near 4821.5. Momentum still suggests sideways motion, but some evidence of potential breakout exists. Upper support sits at 4804.75. Below that, we see congestion near 4796.25 -4792.5 that will serve as lower support. Resistance sits between 4826.75-4836.75, with a breach that could stretch into 4838.5 to 4844.25, if buyers hold power. Pay attention to lower highs or lower lows developing, as this could signal a shift to downside action.
Upside trades for Nasdaq futures trading – Favorable setups sit on the positive retest of 4824.5, or a positive retest of 4812.5 with positive momentum. I use the 30min to 1hr chart for the breach and retest mechanic. Targets from 4812.5 are 4815.5, 4820.5, 4823, 4829, 4831.75, 4836.25, 4838.5, and 4844.25, if buyers continue the rally north.
Downside trades for Nasdaq futures trading – Favorable setups sit below the failed retest of 4816.25, or at the failed retest of 4824.5 with negative divergence (particularly important here). Retracement into lower levels from 4824.5 gives us the targets 4821.75, 4817.75, 4814.5, 4811.75, 4809.25, 4805.75, 4801.75, 4796.75, 4792.75, 4789.5, 4785.5, 4777.75, and 4771.5 to 4767.5, if sellers resume control.
Crude Oil
With the EIA report out at 10:30am today, and the API yesterday showing a much bigger build, we are sure to have quite a bit of movement today. We are still in the middle of a retracement event that could send us into 45.57. Currently support holds at 46.9, and below there, 46.27. Resistance sits near 48.33, with 48.86 above that.
Trading ranges for crude oil prices should hold between 45.5 and 48.54 today.
Upside trades on crude oil futures can be staged on the positive retest of 47.49, or at a positive retest off 46.96 with positive momentum. I often use the 30min to 1hr chart for the breach and retest mechanic. Targets from 46.96 are 47.12, 47.41, 47.6, 47.76, 47.9, 48.05, 48.15, 48.52, 48.73, 49.09, and the outside chance that we see 49.48, if buyers power forward.
Downside trades on crude oil futures can be staged on the failed retest of 47.12, or at the failed retest of 47.55 with negative divergence. Targets from 47.55 are 47.39, 47.25, 46.96, 46.74, 46.49, 46.29, 46.16, 46.07, 45.94, and 45.57, if sellers continue control.
If you’re interested in the live trading room, it is now primarily stock market futures content, though we do track heavily traded stocks and their likely daily trajectories as well – we begin at 9am with a morning report and likely chart movements along with trade setups for the day.
As long as the trader keeps himself aware of support and resistance levels, risk can be very adequately managed to play in either direction as bottom picking remains a behavior pattern that is developing with value buyers and speculative traders.
Twitter: @AnneMarieTrades
The author trades stock market futures every day and may have a position in mentioned securities at the time of publication. Any opinions expressed herein are solely those of the author, and do not in any way represent the views or opinions of any other person or entity.


