S&P 500 Index Futures Price Analysis Chart – October 23
MARKET COMMENTARY
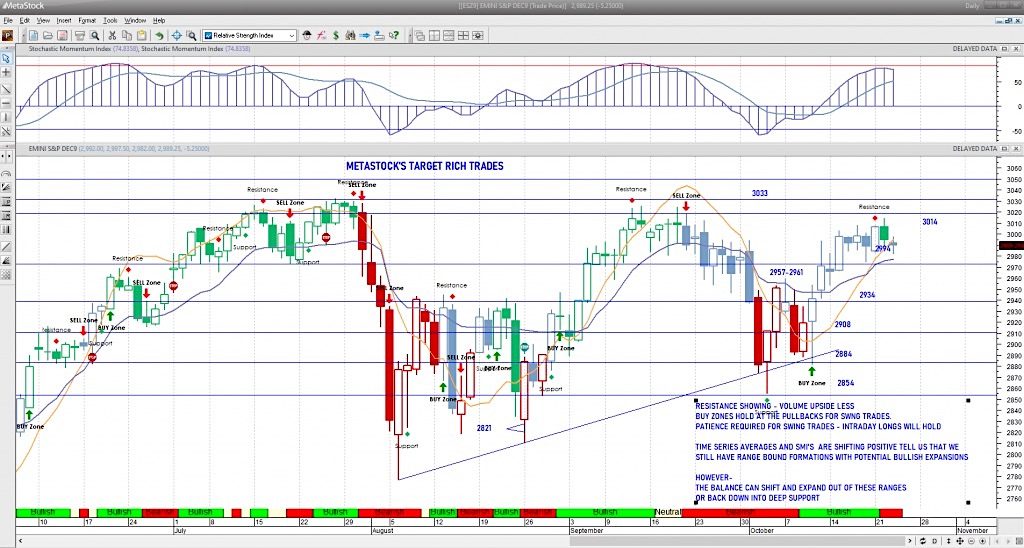
I am noting that the upside pressure holds less buying volume than selling volume. As such, we bumped into highs on S&P 500 Index and have faded.
The big picture feels much like reversion to the mean with so many things fueling crosscurrents. Neutral to bullish formations remain- that means pullbacks are buy zones.
The key price level to watch on S&P 500 futures this morning is 2983 – we have staged a bounce above that level.
WEEKLY PRICE ACTION
Neutral to bullish action with a hold over 2982 keeps us a bit more bullish, with slightly positive momentum present. Yesterday’s volume was light – as in days past. This morning, indices are at midrange edges of the volatility range noted-just over breakout areas – for all the charts we watch. Pullbacks ought to be buying regions but news algorithms make the ranges wide so use caution jumping in – particularly if we fade through 2982 on the week. Look below for the intraday motion parameters.
COMMODITY & CURRENCY WATCH
Gold prices bounced off support near 1487 – below here we’ll be more bearish. Today, the chart will try to breach 1500. Use caution with size – there is significant risk in the chart-in both directions. The US dollar is at a major support region and bouncing – it’s been a while since this lost support so a bounce that holds will be very important. WTI sits below 54 after a massive bounce lost all its steam. We have EIA today . Traders have been very clear on how important it is to hold this 52-53 levels as support.
TRADING VIEW & ACTION PLAN
Buyers failed key breakout level above 3006 in the ES_F yesterday. Be patient and wait for your setups means that mornings like this that come into key support means that we can engage at the 2982ish region. Understand your levels and prepare for them. Realize that we could bounce higher than anticipated and fade deeper than anticipated before returning to the range. Follow the trend in the shorter time frames and watch the price action.
The theme of motion is NEGATIVE AS LONG AS WE HOLD BELOW 2981ish today (with bounces failing and deep pullbacks holding)-and POSITIVE AS LONG AS WE HOLD ABOVE 2997.75ish today (with big spikes fading back into congestion) – choppy inside the range. Do what’s working and watch for weakness of trend. Please log in for the definitive levels of engagement today.
METASTOCK SWING SHORT – inactive
METASTOCK SWING LONG – Patience. Red diamond says we should be looking at the chart in terms of taking profits. Not re-engaging long until the tests of proper support.
Intraday LONG trading from support edges like the VWAP or solid moving averages will give you the least risk event for engaging (with stops).
Learn more about my services over at The Trading Book site.
Twitter: @AnneMarieTrades
The author trades stock market futures every day and may have a position in mentioned securities at the time of publication. Any opinions expressed herein are solely those of the author, and do not in any way represent the views or opinions of any other person or entity.
: Creating Bullish Divergence?")

 and Semiconductors (SMH): Concerning Price Pattern?")
 and Semiconductors (SMH): Concerning Price Pattern?")


