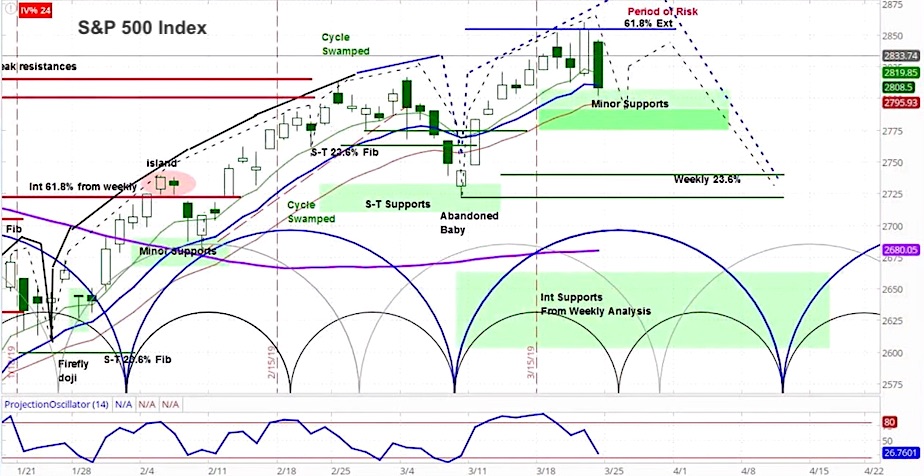
Look for another week in which rallies fail, as stocks continue to build an intermediate top. The S&P 500 (SPX) fell 21 points last week to 2801, a decline of 0.7%.
This occurred as the Fed pointed to slower economic growth and the yield curve confirmed something was awry.
Our projection this week is for stocks to decline for a couple days and then rise towards the end of the week.
Stocks began the week relatively calmly, bumping around and waiting for the Fed. While the market did pop, it closed the week lower, as I pointed out in the latest Market Week show.
Our approach to technical analysis uses market cycles to project price action. For this week, while our overall bias is lower, we believe this week will be choppy. More specifically, we are looking for a dip into the 2775-2790 short term support zone.
This will likely be followed by a move to the upside before the end of the week. If it follows through in this manner, we believe the latter may be an opportunity to sell, as we enter into the declining phase of the current intermediate market cycle.
S&P 500 (SPX) Daily Chart

Market Week Video – March 24, 2019
The Federal Reserve announced this week that was lowering its GDP forecast from 2.3% to 2.1%. It also confirmed that it would not raise interest rates this year and would reduce, then end the rolloff of its balance sheet. This was a surprisingly dovish Fed meeting, in the face of some very rosy economic comments from Chairman Powell.
Meanwhile President Trump interjected that, “If we didn’t have somebody raising interest rates and doing quantitative tightening we would have been over 4% (GDP growth),” referring to the Fed’s 2018 policy.
Sadly, that suggests a poor understanding of the Fed’s actions over the past two decades, and how that created the challenging condition in which central banks now live.
In support of the weakening conditions, both FedEx (FDX) and Nike (NKE) pointed to grumbling in the global economy during their earnings calls. While the US economy appears to be outperforming others, it’s unlikely it will remain unaffected.
Later in the week, the yield curve inverted, meaning that short term interest rates rose above long term rates. Specifically, the yield on 3 month treasuries was 2.46% compared to 2.44% for 10 year treasuries.
This is the first time this has happened since 2007 and is considered by many to be an indicator that a recession is on the horizon. This puts some fund managers in the condition of being mandated to lower risk.
Looking further at the macroeconomic picture, some indicators looked good while others pointed to cracks in the glass. For example, while the Philly Fed and existing home sales exceeded market expectations, US services PMI and German manufacturing PMI fell short.
Stepping back, our analysis of longer term market cycles indicates bearish price action over the coming 18 months. Looking at the daily chart for the S&P 500 (SPX), we believe the coming weeks may produce an intermediate term top.
For more from Slim, or to learn about cycle analysis, check out the askSlim Market Week show every Friday on our YouTube channel.
Twitter: @askslim
Any opinions expressed herein are solely those of the author, and do not in any way represent the views or opinions of any other person or entity.


