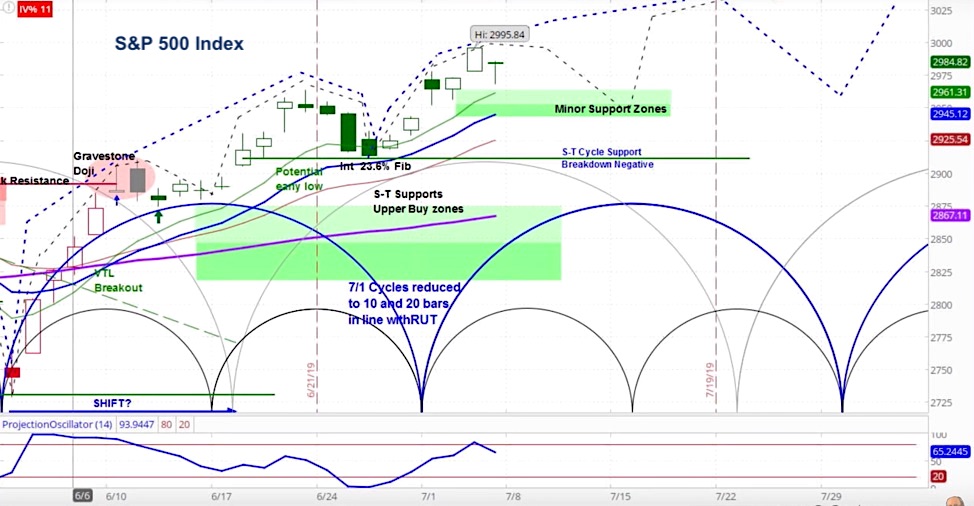
The S&P 500 Index (INDEXSP: .INX) rose 58 points last week to 2990, an increase of 2%.
However, the global economic data continues to show signs of weakness.
Let’s analyze stock market cycles and see what we uncover for the weeks ahead.
The stock market last week continued its rise to previously unknown levels, with investors buying into the July 4th holiday albeit in relatively low volume, as I pointed out in the latest Market Week show. See video below.
Our projection this week is for the SPX to decline as the current minor cycle corrects.
Our approach to technical analysis uses market cycles to project price action. Our analysis is for the S&P 500 to pause for the latter half of the current minor cycle, before resuming its move higher. Our support zone is 2945-2965, with an upside target of 3032.
S&P 500 (SPX) Daily Chart

Video
Yet this occurred while the global economy pointed to a slowdown, as purchasing managers indexes (PMI) in the US and around the world missed expectations.
Ironically, the market was disappointed when US nonfarm payrolls exceeded the average forecast by so much that hopes for the Fed rate cut were temporarily dashed.
For more from Slim, or to learn about cycle analysis, check out the askSlim Market Week show every Friday.
Twitter: @askslim
Any opinions expressed herein are solely those of the author, and do not in any way represent the views or opinions of any other person or entity.


