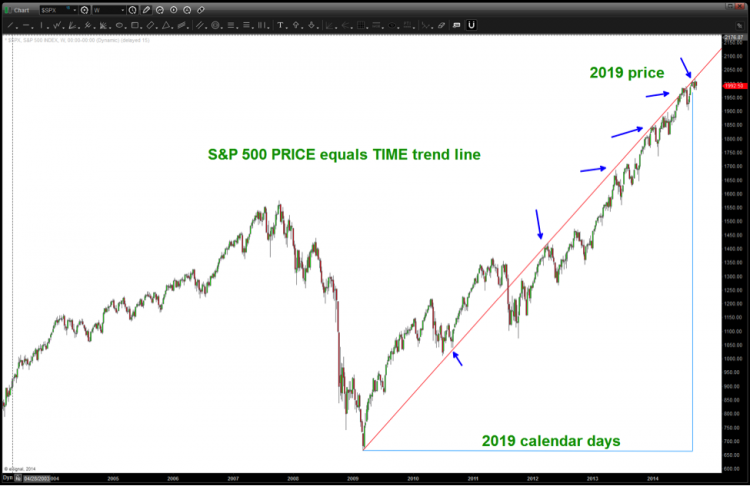
 In some of my past posts I have discussed how we can move the decimal point on something like the low of the S&P 500 on March 06, 2009 at 666 and find time and price value. It goes something like this: move the decimal point to 66.6 and on Monday we hit 66.6 months since the low in 2009. This is called a square out, and reflects where/when PRICE and TIME are equal. Note that we were also squaring out calendar days on the S&P 500 around 2019.
Below is a chart showing the trend line created from PRICE and TIME being equal …note the arrows where the market hit the trend line. Click to enlarge charts.
S&P 500 Daily Chart – Square Out?
This gets me to another major topic of interest: recent Euro weakness and US Dollar strength. So let’s take a closer look at the EURUSD. Square outs ith currencies it can get a little tricky, but let’s walk through the motions.
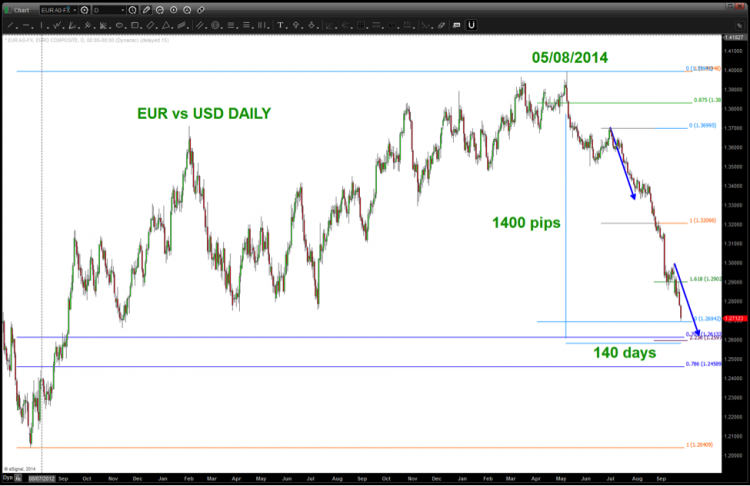
If we do a calendar day count from the last high on the EURO on May 09, 2014 we get 140 calendar days. Since we really don’t care about decimal points (a subject over a cocktail) convert like this:
- HIGH was 1.3989 or 1.4000 (work with me people)
- 4000 = 4000
- 140 days = 1400 (interesting – high 1.400 and we’re down 140 days)
- 4000-1400 = 2600
- 2600 = 1.2600
- 4000 square root = 63.25
- (63.25-12)^2 = 1.2626
Here’s the picture…
EURUSD Daily Chart – Square Out?
So, to recap: we are at MONSTEROUS bearish sentiment, we have completed our full cycle of 1/8 th increments DOWN in around 1.2694, we have extreme oversold conditions and now we can add a PRICE and TIME square out to the mix. Obviously, the only men in the world to successfully step in front of an oncoming train and stop it were Hancock and Superman… and, last time I checked, they aren’t real. Now I’m not advocating stepping in front of this train BUT the time may be nearing for traders to BUY EURO vs USD – I believe we’ll see it finish this down move soon.
If you’ve read this far, congratulations! This shows that you at least have some interest in square outs. Thanks for reading.
Follow James on Twitter: @BartsCharts
No position in any of the mentioned securities at the time of publication. Any opinions expressed herein are solely those of the author, and do not in any way represent the views or opinions of any other person or entity.


