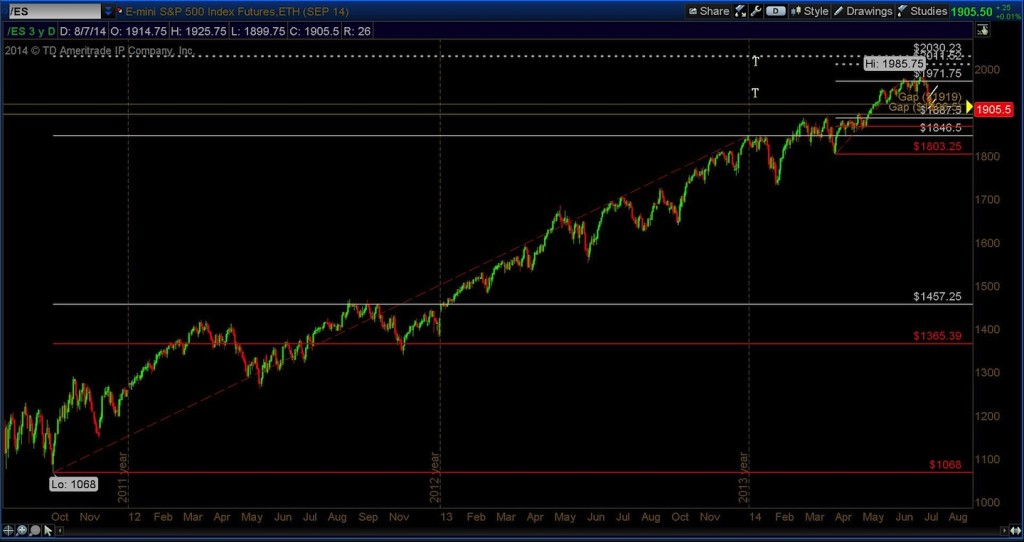
The S&P 500 E-mini contract, the ES, is now reaching support levels that I’m watching closely. Let’s start with a full view of a 3 year daily chart. Since November 2011, the contract has moved up 917.75 points. Time for a correction? I would say it’s in progress now.
In the S&P 500 E-mini chart below you can clearly see what a full blown bull market looks like.
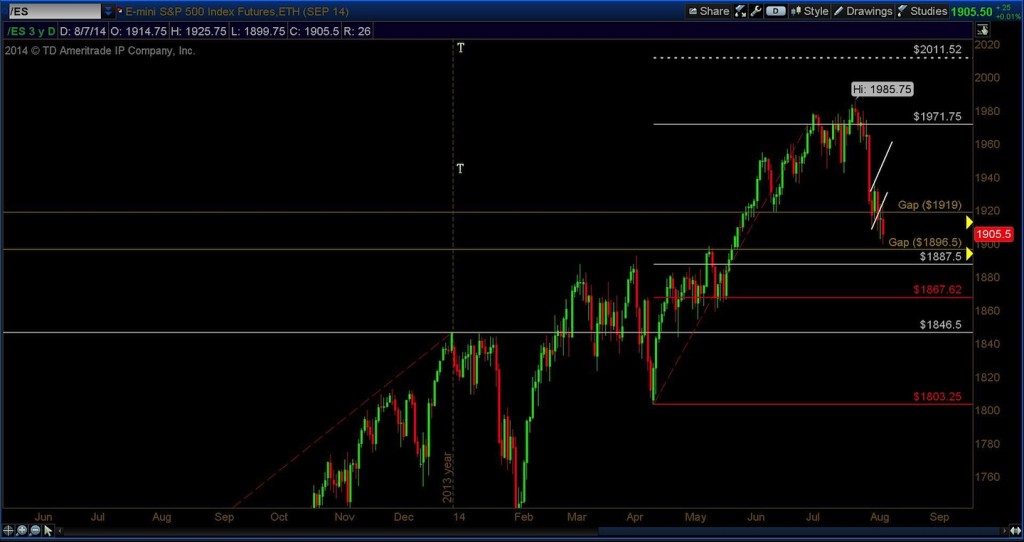
Now, let’s drill down a bit; same chart, tighter view. In the chart below you’ll see the move up from April, 2014 to the high in July of 1985.75. The Fibonacci draw gives us a target of 2011.5 with support levels at 1887.5 and 1867.75. There was an open gap at 1919, which is now closed and currently an open gap at 1896.5. I expect price to drop down and at a minimum close that 1896.5 gap. I have also outlined a bear flag that began to form on August 1st and has played out well so far.
If the 1896.5 gap fails to give support, 1887.5 will be the next major support level. A failure of the next level, 1867.75, would reverse the shorter term trend.
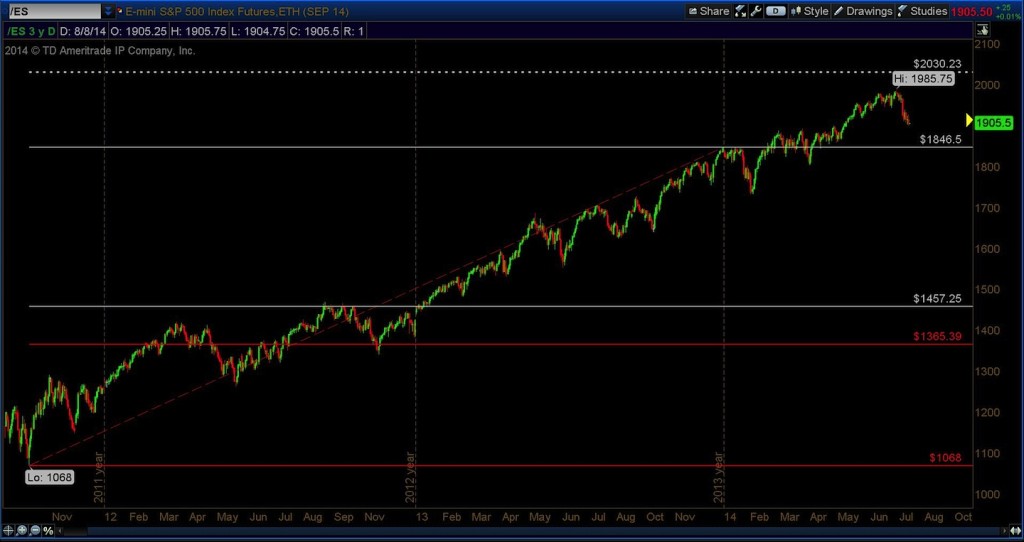
Now, let’s look at the big picture in the chart below. The long term Fibonacci draw gives us a target of 2030 with support levels at 1457.25 and 1365.50. Price would have to pull back and violate both those levels before the 2030 target would be negated.
Can price pull back that far? Sure it can. Is it likely to happen? Even with all the geopolitical events that are occurring right now, I don’t see a pullback that far in the near future. Globally, fundamentals are still showing improvement in manufacturing and no Central bank seems in a hurry to raise lending rates.
Thanks for reading.
No position in any of the mentioned securities at the time of publication. Any opinions expressed herein are solely those of the author, and do not in any way represent the views or opinions of any other person or entity.


