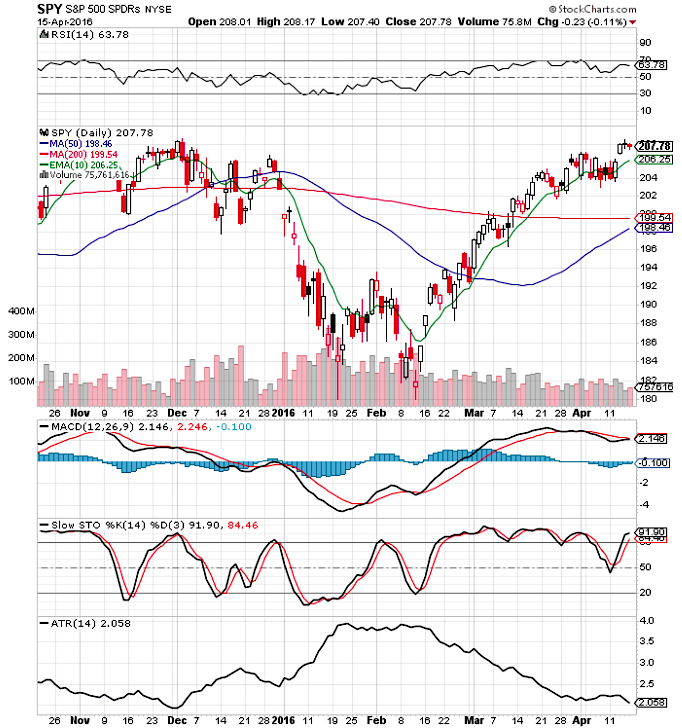
The stock market looks bullish here from a historical standpoint. The S&P 500 (SPY) is currently overbought so some consolidation here shouldn’t be surprising.
Let’s see if the S&P 500 follows through and continues this trend.
Below are 12 bullish signs from the S&P 500 chart below.
1. Bullish gap up on Wednesday help support at the low of they day for the rest of the week.
2. $SPY price is above all key moving averages showing an uptrend.
3. The MACD almost has a bullish crossover.
4. The Slow Stochastics has a bullish cross and is showing momentum.
5. The ATR has begun to decline again. This is bullish
6. Good volume on up days in past weeks.
7. 78 RSI gives $SPY price more room to run before it is overbought. It would be better for the market to go up slowly and build a price base.
8. The $SPY trend is on track for a 50 day/200 day golden cross in coming weeks.
9. We could find key short term support at $207.14, the old resistance level.
10. Gap fill danger back to $206.25. Price should find support there if it back fills.
11. All time highs are back in play now with this momentum.
12. The early plunge and correction in 2016 relieved a lot of selling pressure off the double bottom and the odds are we go higher here.
S&P 500 Daily Chart
Thanks for reading and good luck out there.
Twitter: @SJosephBurns
Read more from Steve on his blog NewTraderU.
The author is long $SPY and $SPXL at the time of publication. Any opinions expressed herein are solely those of the author, and do not in any way represent the views or opinions of any other person or entity.


?")
 Underperforming Major Stock Indices")
