As many momentum, directional and trend traders will attest, the past several months have been pure chop. Despite the new all-time-highs for the S&P 500 Index (SPX), the move higher has been a series of stutter steps.
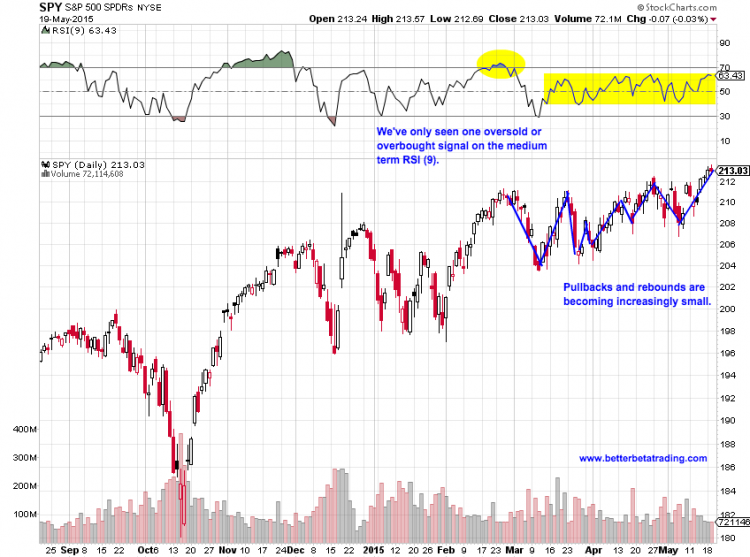
Checking in on the chart of the SPDR S&P 500 ETF (SPY), we can see a clear pattern of smaller pullbacks and bounces since the February rebound. SPY has hovered in a neutral RSI (9) state, tip-toeing into oversold territory only once since the start of the year.
S&P 500 Chart (SPY) with Relative Strength Indicator (RSI)
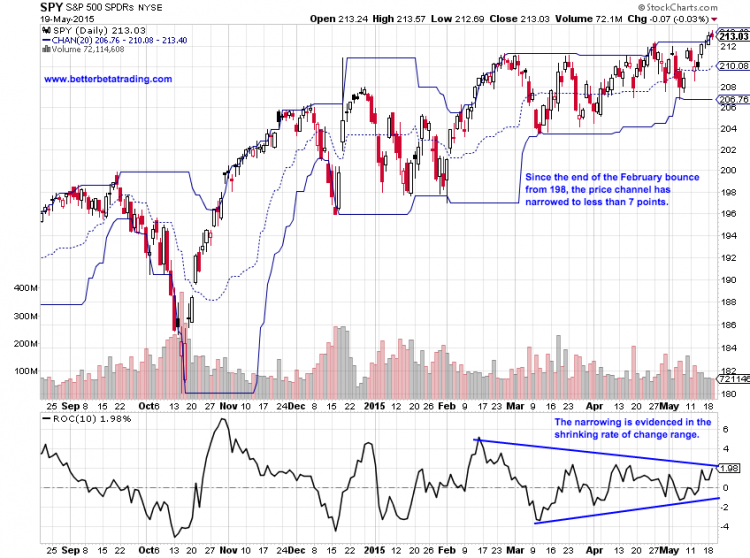
Other technical indicators tell the same story – a rapidly narrowing Rate-Of-Change (ROC) rate, unusually small price channels – all of which highlight the difficulty of trading in this market. But the price compression can’t continue indefinitely. We will be watching for the inevitable resolution on the S&P 500 chart.
2015 has definitely been a year where patience and risk management have been tested.
S&P 500 Chart (SPY) with ROC & Price Channels
Have a great rest of the week. Thanks for reading.
The author does not have a position in the mentioned securities. Any opinions expressed herein are solely those of the author, and do not in any way represent the views or opinions of any other person or entity.


