The stock market reached a critical point in time and price last fall.
This lead to a sharp correction on the S&P 500 and other broad U.S. stock market indices.
And though the rally has been similarly sharp, investors still face an important question: Are the lows in?
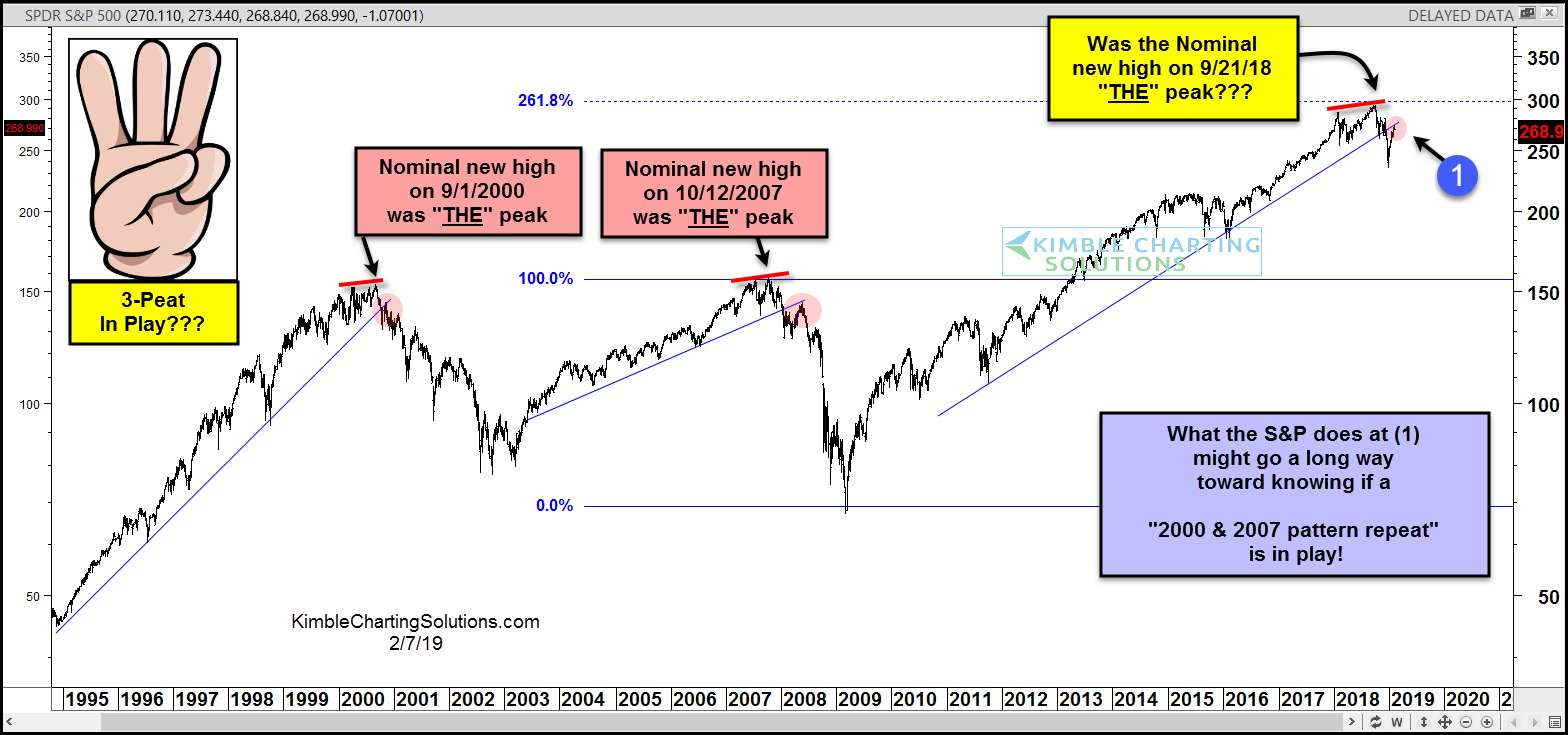
Looking at a long-term S&P 500 chart (below), we can see that the 2000 and 2007 highs are very similar to the 2018 highs. Each market top occurs around the same time period (September/October) and each top is formed after producing a nominal new high.
In each case, the longer-term trend is broken and retested – note the 2000 and 2007 market tops saw retests that failed. The verdict is out on the 2019 retest (1).
While there is no proof that a 3-peat is currently in play, what the S&P 500 does at (1) will go a long way in helping us understand if we are working our way out of a corrective period, or if we are in a bear market. Stay tuned!
S&P 500 Long-Term Chart – 3-Peat In Play?
Note that KimbleCharting is offering a 2 week Free trial to See It Market readers. Just send me an email to services@kimblechartingsolutions.com for details to get set up.
Twitter: @KimbleCharting
Any opinions expressed herein are solely those of the author, and do not in any way represent the views or opinions of any other person or entity.


