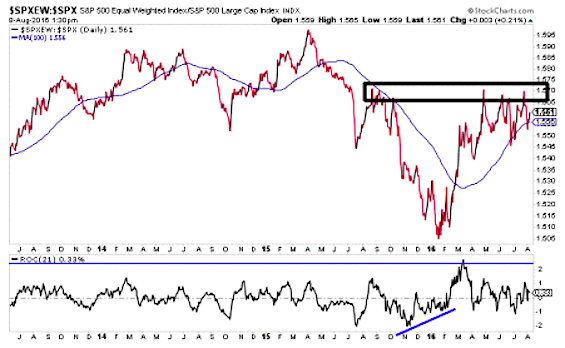
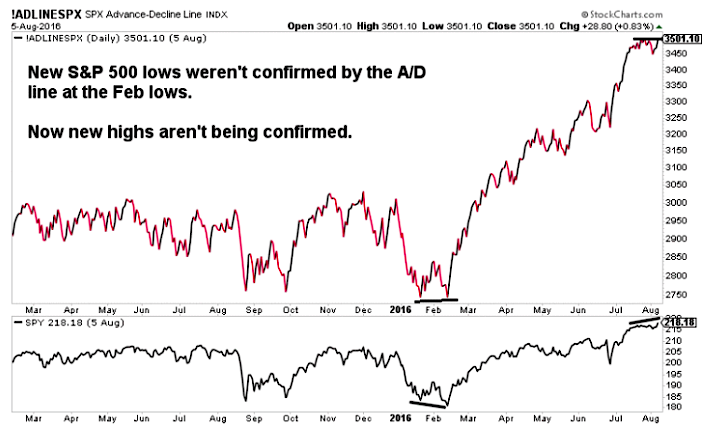
There are two subtle, yet concerning, S&P 500 breadth indicators worth noting as the stock market grinds higher into August.
First is the lack of new highs in the ratio of the S&P 500 equal weight index vs the S&P 500 (INDEXSP:.INX). The ratio hasn’t made new highs since May. In fact, this S&P 500 breadth ratio has failed to take out 2015 or even 2014 highs.
While that is notable and troubling, the trend of the 100 day moving average has been what matters in terms of a “tell” of market direction. For now, that is trending higher. This could become problematic in time.
Second is the lack of new highs in the S&P 500 advance-decline line as the Market made new highs last week. This is the same signal that came at the market bottom in February, just on a shorter timeframe.
So what does all of this tell us? First facts, then theory
Facts: Although participation has been strong, larger stocks are pulling more weight. This is something to keep an eye on until it resolves.
Theory: Perhaps smaller stocks are getting pulled along by ETFs. Also megacap stocks with attractive dividend yields such as AT&T and Johnson and Johnson have seen amazing rallies this year.
Conclusion: I see two chinks in the S&P 500 breadth armor. These charts aren’t foretelling doom, but they are worth watching until they resolve. It’s possible they could become bigger issues in time.
Trade ‘em well!
Read more from Aaron on his blog.
Twitter: @ATMcharts
Any opinions expressed herein are solely those of the author, and do not in any way represent the views or opinions of any other person or entity.


