Stagflation or speed bump to recession?
The macro matters and this current environment is uncertainty at best.
Price continues to dictate the narrative- the analyst dip buyers of MAG7 are out there in full force… but are they right?
What constitutes a bottom? Technically:
Blow off price action to the downside with huge volume, followed by a green day with big volume.
- Can be a new low followed by a close the next day over the previous day high.
- After the new low day, it could be an inside trading day the following day that closes green, then followed by an up day the 3rd day where price closes higher than the high of the day price made a new low.
- Phase change-a move and confirm over a major moving average (50 and/or 200 DMA).
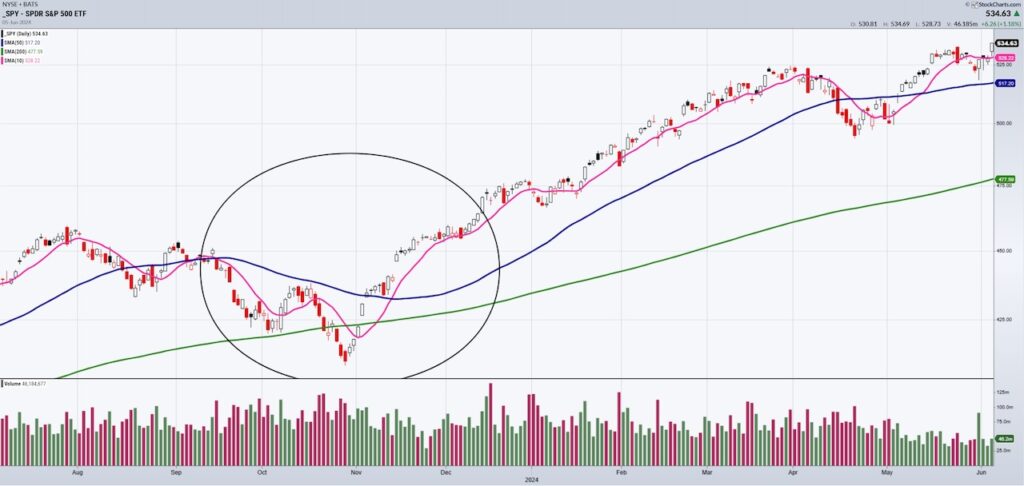
The chart above shows a true bottom in SPY in 2023-
Not the blow off bottom on huge volume. Then the reversal green day right after with good volume. And then, there is the eventual phase change where SPY clears the 50-DMA.
The next chart is as of Wednesday.
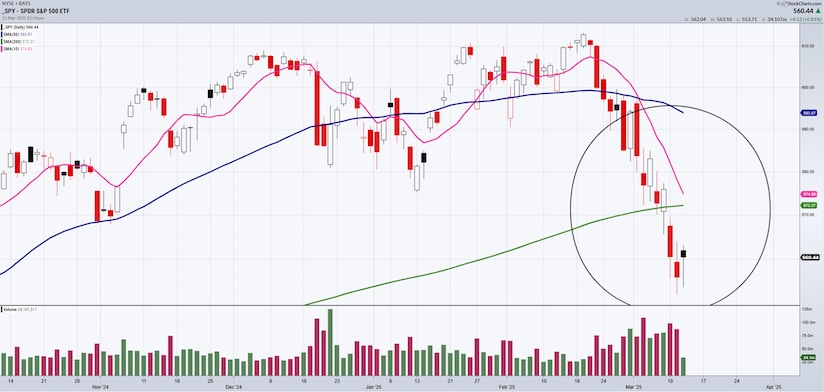
After the big down day and new 60+ day low on huge but not necessarily blow off volume, Wednesday sets up as an inside day.
The volume on the green Wednesday is not impressive.
To confirm a reversal, Thursday the close must be above Tuesday’s high and the volume should be decent.
Short of these patterns I have described, investors should not be so keen on jumping into stocks. And if you feel you must, know your risk and how to position size.
What Does a Technical Bottom in an Index Look Like?
SPY Oct 2023 Bottom
Stagflation or speed bump to recession?
The macro matters and this current environment is uncertainty at best.
Price continues to dictate the narrative- the analyst dip buyers of MAG7 are out there in full force… but are they right?
What constitutes a bottom? Technically:
Blow off price action to the downside with huge volume, followed by a green day with big volume.
- Can be a new low followed by a close the next day over the previous day high.
- After the new low day, it could be an inside trading day the following day that closes green, then followed by an up day the 3rd day where price closes higher than the high of the day price made a new low.
- Phase change-a move and confirm over a major moving average (50 and/or 200 DMA).
The chart above shows a true bottom in SPY in 2023-
Not the blow off bottom on huge volume. Then the reversal green day right after with good volume. And then, there is the eventual phase change where SPY clears the 50-DMA.
The next chart is as of Wednesday.
SPY
After the big down day and new 60+ day low on huge but not necessarily blow off volume, Wednesday sets up as an inside day.
The volume on the green Wednesday is not impressive.
To confirm a reversal, Thursday the close must be above Tuesday’s high and the volume should be decent.
Short of these patterns I have described, investors should not be so keen on jumping into stocks. And if you feel you must, know your risk and how to position size.
Twitter: @marketminute
The author may have a position in mentioned securities at the time of publication. Any opinions expressed herein are solely those of the author and do not represent the views or opinions of any other person or entity.
: Creating Bullish Divergence?")


 and Semiconductors (SMH): Concerning Price Pattern?")


