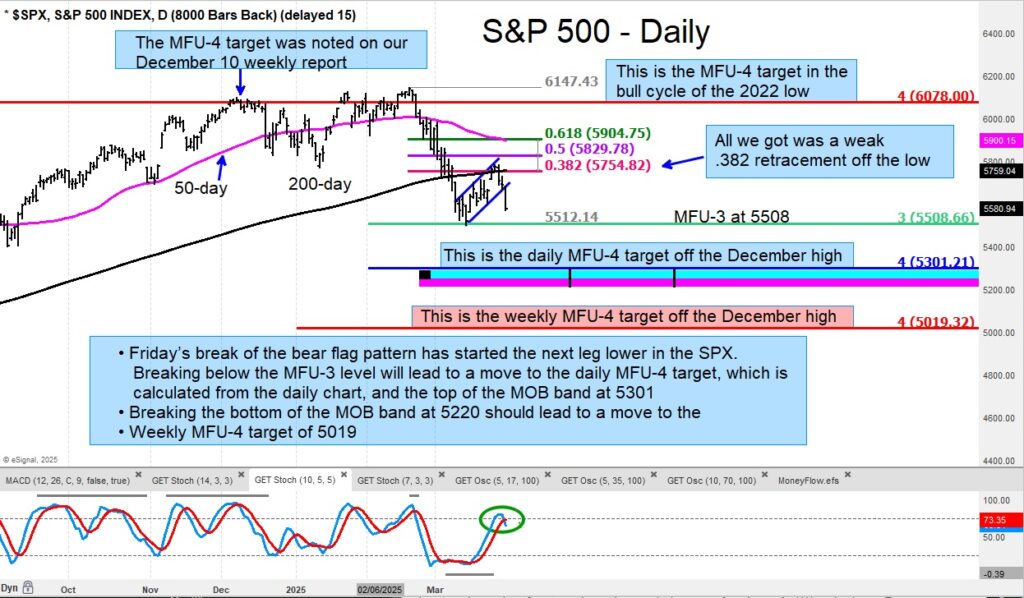
The price chart of the S&P 500 Index (INDEXSP: .INX) is not bullish. In fact, it’s quite concerning right now.
The break of a bearish flag price pattern while under the 200-day average likely means that this key stock market index will have another leg lower (new lows).
Also, the number of stocks in the S&P 1500 with a bearish model score has increased to -74% (current) versus -53% (on 1/24/25).
There are too many stocks that are technically “broken” to expect a bullish turnaround from here.
Perhaps world peace and an end to tariff wars could save the day, but I’m not holding my breath. This is what the data shows; be careful.
S&P 500 Index “daily” Chart

Check out my research offerings on Cerundolo Investment Research.
Twitter: @GuyCerundolo
The author or his firm have a position in mentioned securities at the time of publication. Any opinions expressed herein are solely those of the author, and do not in any way represent the views or opinions of any other person or entity.


