Is The S&P 500’s 200 Day Moving Average Providing Some Insight?
Long-Term Trend
The S&P 500’s 200 day moving average is commonly used to track long-term trends. All things being equal, the stock market bulls prefer the S&P 500 to remain above the 200 day moving average. The bears are more content when price drops and stays below the 200 day moving average.
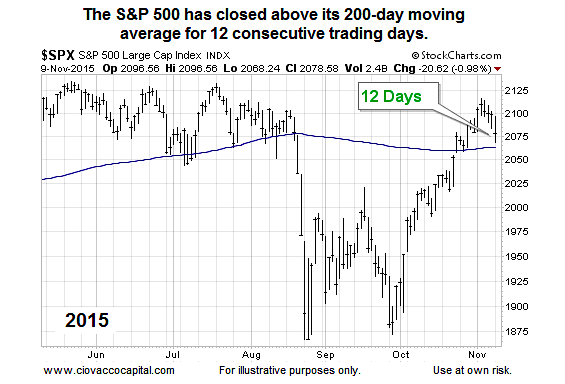
As shown in the 2015 chart below, the S&P 500 has printed several consecutive daily closes above its 200 day moving average (12 as of the 11/9 close).
From a historical perspective, do stock market rallies typically fail or succeed after twelve consecutive closes above the 200 day moving average?
Let’s Have A Look At November 2015…
Also read from Chris: “A Random Walk Through Stock Market Bottoms 1990-2015“
1990 – The Rally Continued
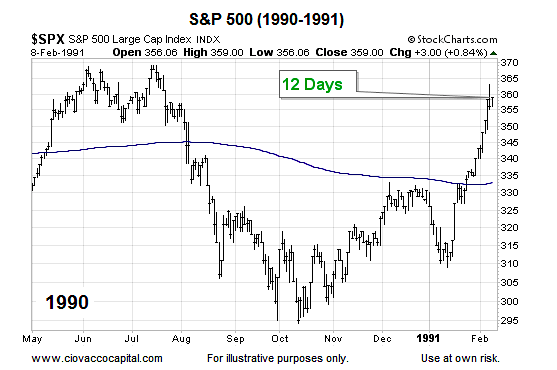
There are not too many historical cases in the last 30 years that featured a significant drop below the 200 day moving average (7% to 19%) followed by a rally back above the 200 day moving average. One case that fits the profile, though, is 1990.
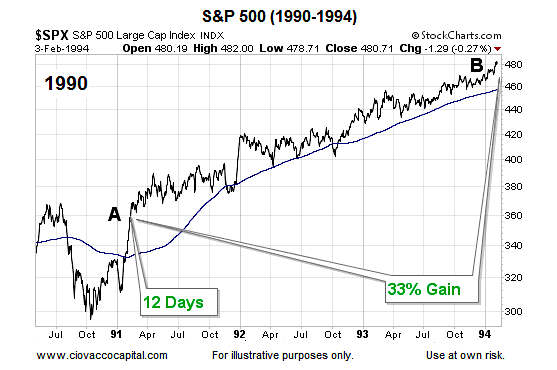
What happened after the twelfth consecutive close above the 200 day moving average? Stocks tacked on an additional 33% between point A and point B.
1998 – The Rally Continued
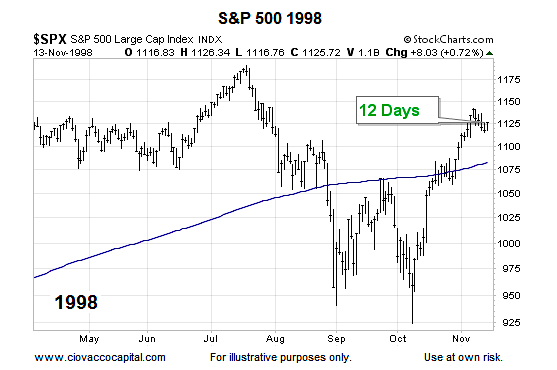
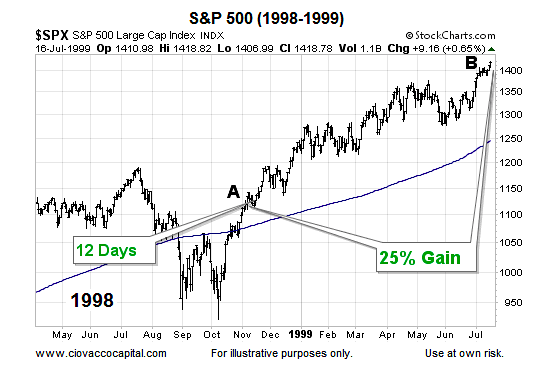
In 1998, the S&P 500 slashed through its 200-day moving average, formed a double bottom, and then rallied back above the 200 day moving average for twelve consecutive sessions, which is similar to what we have seen in 2015.
What happened after the twelfth consecutive close in 1998? Stocks tacked on an additional 25% between point A and point B.
continue reading on the next page…

