Since double bottoming 14 months ago, S&P 500 (INDEXSP:.INX) has been on a persistent path higher.
This rally has the pushed the large cap index into overbought territory on multiple time frames.
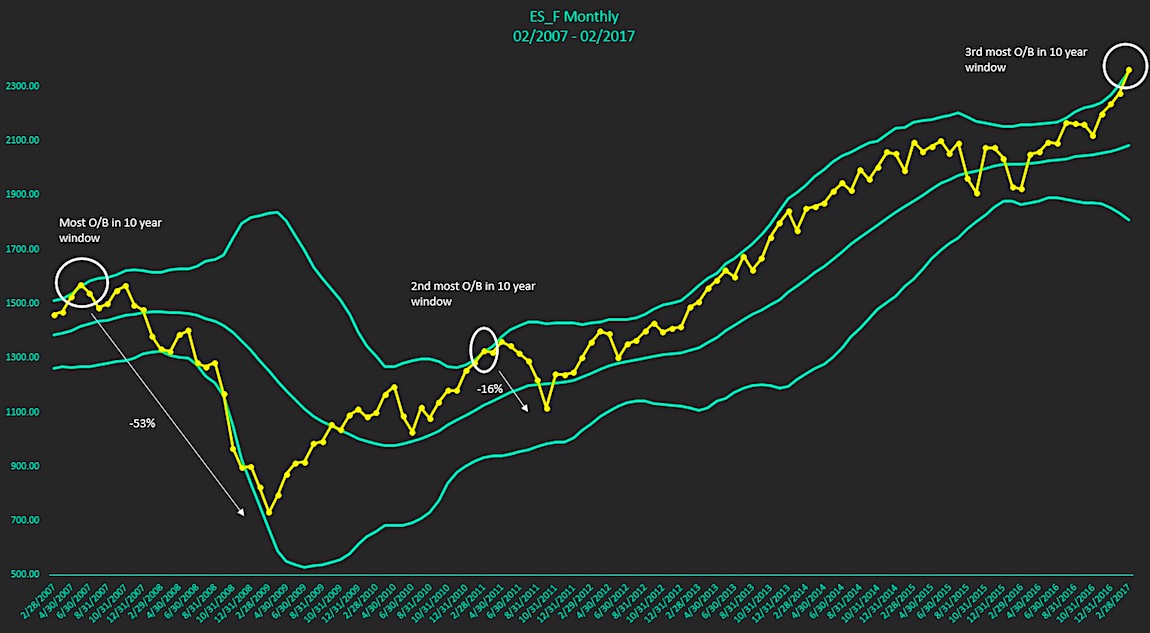
Today we’ll focus on a longer-term “monthly” chart of S&P 500 Futures to highlight how overbought this move is. Eye the futures chart above as you read through the following bullet points about the indicator:
- Moving average = 19-period (HLC/3)
- Bollinger Bands = 2.326 standard deviations (98% of observations fall within if normal distribution)
- Overbought = ((upper band value – close)/upper band value)*100, to get in percentage terms. Then ranked the observations.
- Only 3 observations where close>upper band.
This doesn’t necessarily mean a sell-off is forthcoming, as “overbought” can be remedied through time and/or price and the moving average has positive slope itself. However, the first two occurrences saw meaningful reversals.
Check out more of my research over at Global Technical Analysis. Thanks for reading.
Twitter: @Techs_Global
Any opinions expressed herein are solely those of the author, and do not in any way represent the views or opinions of any other person or entity.

: Showing Some Signs of Emerging Strength")
