 By Andrew Nyquist
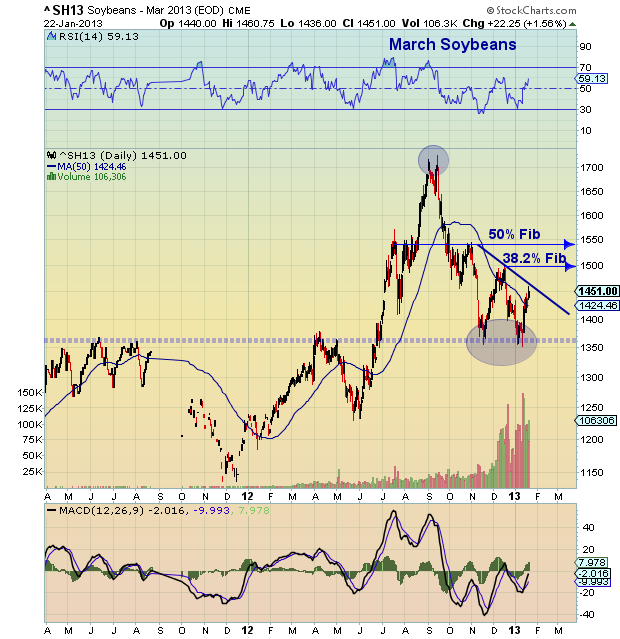
After a dizzying run higher from December 2011 to September 2012, Soybean futures retraced roughly 50 percent of those gains to 13.50. It is also noteworthy that the 50 percent Fibonacci retracement area coincides with strong lateral support in the Soybean futures chart analysis below.
The initial pullback to 13.50 brought about a bounce to the 38.2 Fibonacci level at 15.00. The second bounce is still to be determined, but if price breaks the descending downtrend line (14.60), it will likely move swiftly back to 15.00. Above that and there is a case to be made for a double bottom.
For now, watch the descending downtrend line and the 13.50 support floor.
Trade safe, trade disciplined.
Soybean Futures Chart Analysis:
March Soybean futures chart analysis with Fibonacci retracements and technical analysis. A closer look at the March Soybeans price patterning.
Twitter: @andrewnyquist and @seeitmarket Facebook: See It Market
No position in any of the mentioned securities at the time of publication.


