What do we as investors know about rainbows? Let’s see…
Rainbows are optical illusions. They appear in the sky opposite the sun.
Rainbows can be full circles, although we normally see them as arcs. Although many rainbows can exist, only one can be seen by an observer, depending on the viewpoint as droplets illuminated by the sun.
How is the stock market like a rainbow?
This recent rally is built upon optical illusions.
The rally appears opposite the sun-or source of energy.
The stock market has arced but looks like it’s headed towards a full circle.

Although many factors (like the disparate economic Modern Family) exist, observers see what they want depending on their viewpoint.
Perhaps the most exciting aspect of rainbows, is that they are ephemeral. Lucky for us when we get to see them.
Is that the same with the market–ephemeral and lucky when we get to trade a rally?

The Family is as colorful as a rainbow.
And, depending on which sector you look at, determines how you see that rainbow.
Nonetheless, what we want to explore is whether this recent rally is truly like a rainbow or fleeting to the bulls.
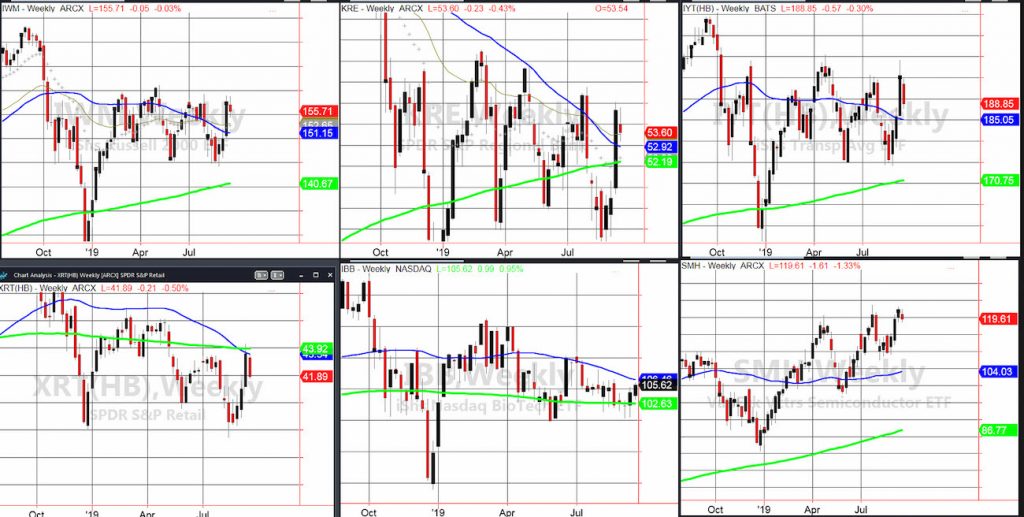
These are weekly charts for perspective. Interestingly, four of the six members had inside trading weeks (the range was inside the range of the week before.)
Top left is Russell 2000 IWM.
IWM had a inside week. The slope of the 50-WMA is negative which still suggests the current bull phase is a weak one. Watch the way the range breaks in the coming week.
Middle top is Regional Banks KRE. With an inside week and a negative slope on the 50-WMA, the bias is bullish but with caution. Furthermore, the 50-WMA is getting closer to the 200-WMA, which could mean renewed selling could lead to a death cross.
Top right is Transportation IYT. Another inside week with the 50-WMA slightly neutral but leading toward a negative slope.
All of these charts suggest that they are ok for now, but can easily sell off.
On the bottom left is Granny Retail XRT. XRT had an inside week and is in a death cross or bearish phase. As the weakest member of the Family, the continuing decline of the slope on the 50-WMA suggests more selling is on the way.
Next is Biotechnology IBB. This did not have an inside week. However, this is not in a positive phase, rather sits in a caution phase. As the member of the family best to measure speculative interest, we see a return of buyers here. As the only member to close Friday green, the question is whether this can clear the 50-WMA at 106.46.
Finally is the chart of Semiconductors SMH. It broke 120 as a pivotal area and briefly broke last week’s low. What you should watch for is the new all-time high that was made in July, compared to the lower high made 2 weeks ago and now, the even lower high from this week.
This pattern could turn into a short opportunity in SMH against the recent highs, not to mention it can negatively influence the already weaker sectors.
What we all need to watch for is the mythical pot of gold
at the end of the rainbow. Can we reach it or will we be singing, When happy little bluebirds fly, beyond the rainbow, why oh why can’t I?
S&P 500 (SPY) 300 now the closest resistance. 295 is the 50-DMA.
Russell 2000 (IWM) 155 must hold or we will see a move closer to 152.25 or its 50-DMA. And over 159 everything changes.
Dow (DIA) Like SMH, lower highs so now we want to see this hold 266.50
Nasdaq (QQQ) 192 immediate resistance and could easily see 189.44 the 50-DMA or worse, down to 187.50 next
KRE (Regional Banks) 53-55 the range to watch.
SMH (Semiconductors) 120 immediate resistance. Under 118.31 or the gap low from September 5th, if fails, could see 116.00 or the 50-DMA.
IYT (Transportation) 190 is now the resistance with 186.50 or the 50-WMA support.
IBB (Biotechnology) 104.39 is the 50 DMA to hold if this is any good. And must clear 106.35 or the 50 DMA.
XRT (Retail) Broke the recent range and now 42.00 the resistance with some support at the 50-DMA at 41.20
Twitter: @marketminute
The author may have a position in the mentioned securities at the time of publication. Any opinions expressed herein are solely those of the author, and do not in any way represent the views or opinions of any other person or entity.


