Just like the entire month of May when folks were saying “Sell in May and go away,” not us..
We were telling you that the Big View Risk Gauges were all pointing to risk on.
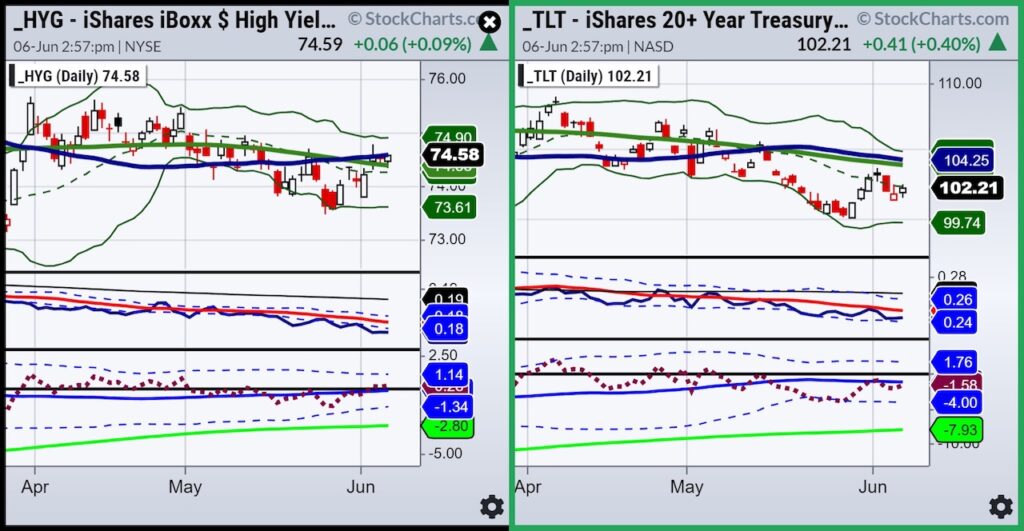
However, before that, on March 12, 2023, we also saw the now confirmed island bottom in the long bonds (TLT).
The title of that Daily Update, “Long Bonds: Island Bottom and the Signal of Chaos“, represented the Regional Bank debacle, now well in our rear view mirror.
Nonetheless, we imagined then that should 20+ year bonds continue to go north, and that too can be inflationary.
We started the year introducing our report, How to Grow Your Wealth in 2023.
In this Year of the Yin Water Rabbit, we began with:
You Can’t Run with the Hare and Hunt with the Hounds.
One thing we do know, while risk on prevails, anything this year can change and change quickly.
That IS the nature of Stagflation.
The chart of both the long and junk bonds tells us that currently, junk outperforms. So bulls, we are ok.
Our job is to keep you one step ahead to prepare your portfolio before it’s too late, which we assume by now you have learned needs to be active rather than passive.
We found it curious though, with indices all up June 6th, the TLTs also went green.
Maybe premature, maybe nothing-but at least now, you are paying attention.
Should we get an up day in TLT and a down day in HYG, that can be a great alert.

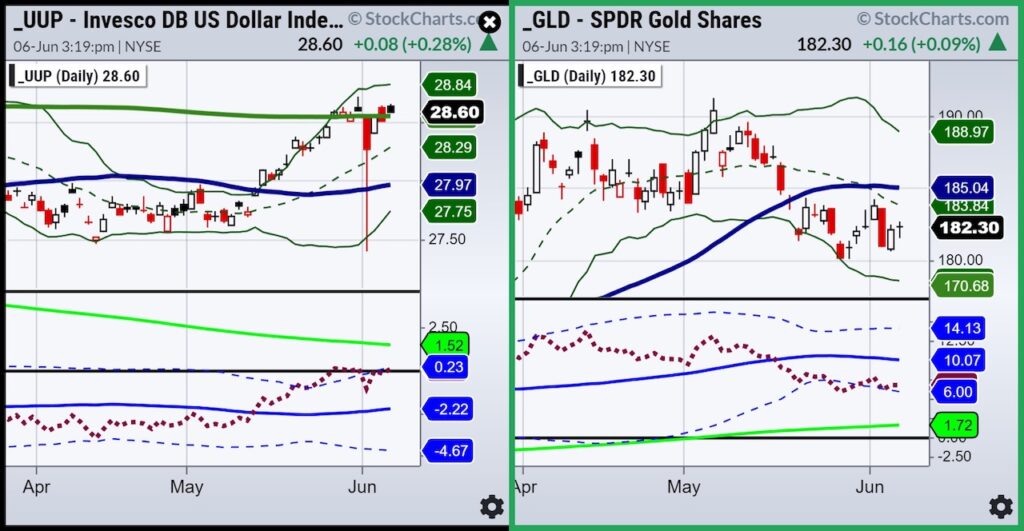
The dollar has been strong. UUP the ETF shows price above the 200-DMA (green).
Our Real Motion Indictor tells us the dollar remains in a mean reversion sell signal. Hence, watch for continuing weakness.
The gold chart (GLD ETF) is in a caution phase. Many are getting negative gold. Not us.
We see a buy mean reversion signal on our Real Motion.
Gold has done a great job holding $1950 in futures. Now, over $2000 which should correspond with 185 in GLD, things can get interesting.
And speaking of commodities, the grains, softs and industrial metals are looking alot better.
Stock Market ETFs Trading Analysis & Summary:
S&P 500 (SPY) August 2022 high 431.73-and of course 420 now key
Russell 2000 (IWM) 180-now must hold while still miles from its 23-month MA 193
Dow (DIA) 23-month MA 337 pivotal
Nasdaq (QQQ) 370 resistance 350 now closest support
Regional banks (KRE) 42.00 pivotal
Semiconductors (SMH) 142.50 the 10-DMA held on this correction so far
Transportation (IYT) 230 level is key
Biotechnology (IBB) 121-135 range
Retail (XRT) Granny cleared 60-rotation to value and beat up discretionary is a good sign
Twitter: @marketminute
The author may have a position in mentioned securities at the time of publication. Any opinions expressed herein are solely those of the author and do not represent the views or opinions of any other person or entity.


