Technology stocks have been market leaders. And over the past couple weeks, the broader tech market has been consolidating gains.
It’s been a longer consolidation for the Software Sector ETF (IGV). Today, we take a look at IGV’s price chart.
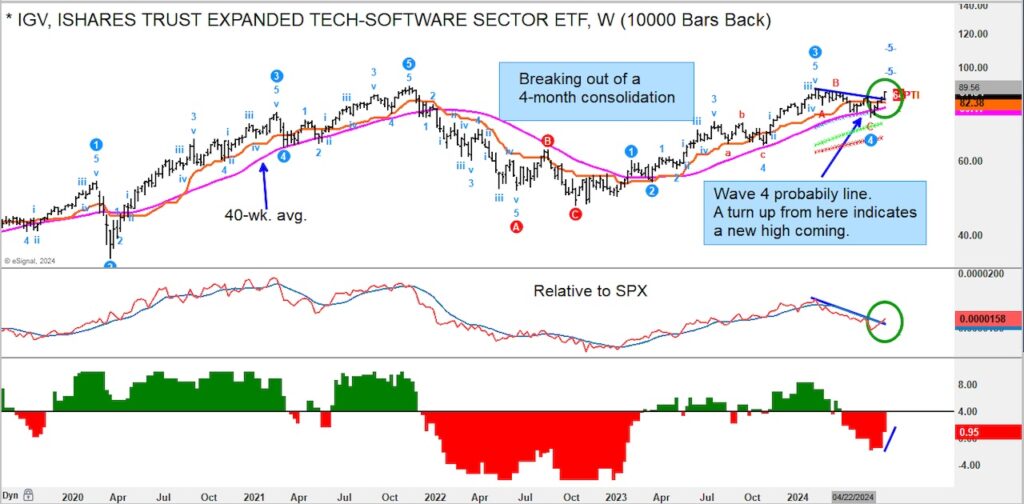
Note that I only use wave counts to help qualify a pullback within an uptrend. Here we have the recent pullback finding a low in May (labeled as a wave 4) and a turn-up from the light blue star line (unique to this software). Holding at this line and turning back up indicates an 80% probability of a new high.
This turn higher is also off the 40-week moving average. I like the turn-up in the relative line as well. As always, we need to see follow on buying next week for this to stick.
$IGV Software Sector ETF Chart