Stocks continue to show strength into 2024. And one index that has been a laggard appears to be perking up.
The small cap Russell 2000.
When small caps begin to outperform, it’s often an indicator that investors are taking more risk on. And this would be a welcome addition.
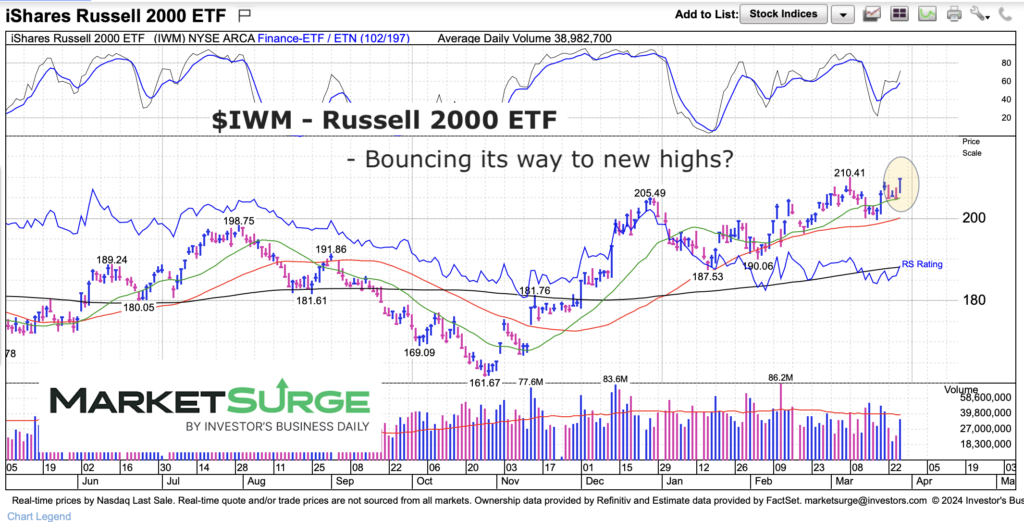
Currently, the Russell 2000 is trading at important breakout resistance but needs to see a buying surge that sticks. Let’s look at the chart.
Note that the following MarketSurge charts are built with Investors Business Daily’s product suite.
I am an Investors Business Daily (IBD) partner and promote the use of their products. The entire platform offers a good mix of tools, education, and technical and fundamental data.
$IWM Russell 2000 ETF Chart
Looking at the chart below, I have a few macro takeaways. First, the price pattern looks like a bullish cup with handle. This would be triggered by a strong breakout here. Second, all 3 major moving averages are rising. This is a bullish intermediate term indicator (and short-term if we see a breakout here). The last note is my only concern that I’m watching: the potential of a rising triangle wedge. As long as price stays above the 50-day moving average (roughly in line with up-trend line), bulls are in control.

Twitter: @andrewnyquist
The author may have a position in mentioned securities at the time of publication. Any opinions expressed herein are solely those of the author, and do not in any way represent the views or opinions of any other person or entity.


