The broad stock market is struggling this week as investors appear to be hitting the “sell” button into the November 3rd elections.
One particular area of the stock market that is struggling (and noteworthy) is the Russell 2000 Index and small cap stocks.
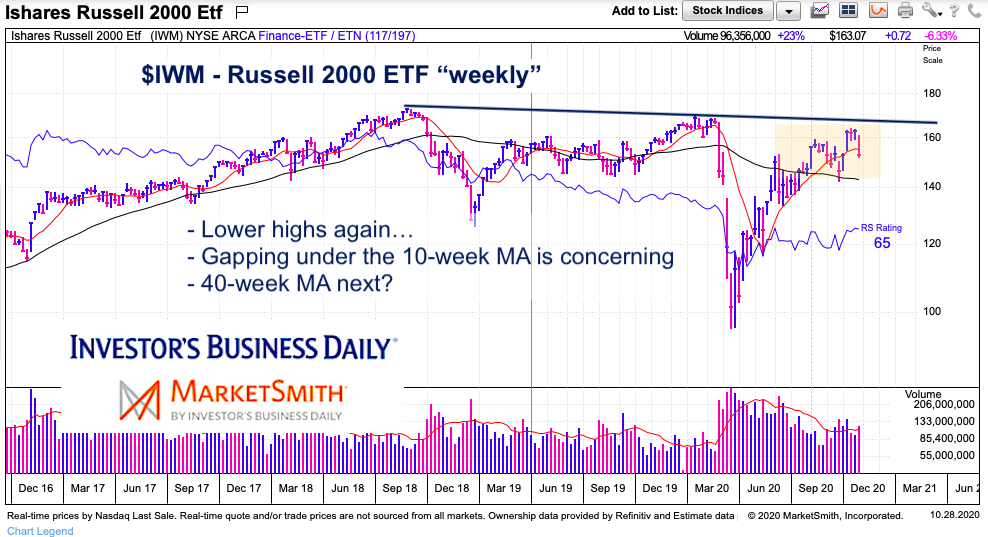
Today’s chart of the Russell 2000 serves as a reminder that we don’t want to get too “juiced” up on lagging sectors and indexes. And that breakouts need follow-through.
Note that the following MarketSmith charts are built with Investors Business Daily’s product suite.
I am an Investors Business Daily (IBD) partner and promote the use of their products. The entire platform offers a good mix of technical and fundamental data and education.
Russell 2000 “weekly” Chart
Just as investors began turning optimistic / bullish again in October, the small cap index attempted to break out. That didn’t go so well. After a few days at new multi-month highs, the Russell 2000 failed to see confirmation buying and headed lower. In fact, this week it is breaking below its 50-day moving average (occurred on Wednesday’s gap lower) and 10-week moving average.
Oh, and the index put in a lower high on its breakout attempt. Lagging indexes are hard to get behind, especially without confirmation / follow-through buying.

Twitter: @andrewnyquist
The author may have a position in mentioned securities at the time of publication. Any opinions expressed herein are solely those of the author, and do not in any way represent the views or opinions of any other person or entity.


