Before we get into the chart and subject of today’s column, the silver to gold ratio, let’s do a quick recap of the financial markets today.
The Modern Family of ETFs, Regional Banks (KRE), Transportation (IYT), the Russell 2000 (IWM), Retail (XRT), Biotechnology (IBB), and Semiconductors SMH, is whacked.
Over the weekend, we saw the divergence among sectors-or what is starting to look like the have’s versus the have-not’s.
As mentioned in the weekend Daily, “Rarely have I seen such variation among sectors-from new all-time high bullish patterns, to ominously bearish ones.”
And we wondered if Monday would help us determine who is right.
Would it be the almighty Semiconductors joined by the Transportation Sector?
Or, the meek Russell 2000, Retail Sector, the Regional Banks and Biotechnology?
If the law of “majority rules” has any significance, the weak outnumber the strong.
Yet, the strong were really strong today. While the weak were really weak.
So, who wins?
With the U.S. economy more reliably measured by the weaker sectors, perhaps now is a good time to look at the silver to gold ratio.

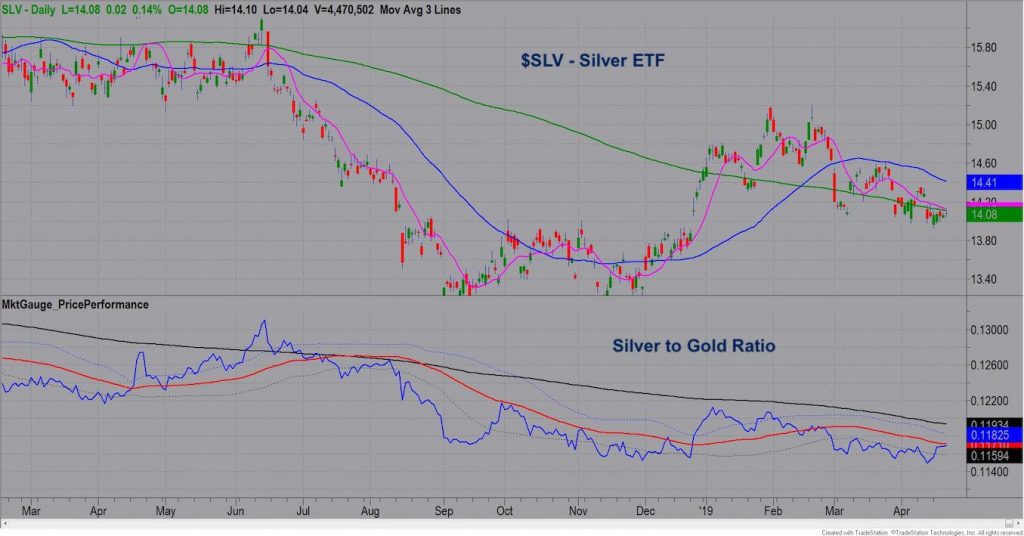
Top chart is the daily chart of the Silver ETF (SLV).
The phase is Distribution, which means that the 200-DMA (green) is below the 50-DMA (blue) and the price sits below both MAs.
That is not a strong phase. In fact, it means that there is literally a distribution out of the instrument into cash or something else.
Now, I have gotten a lot of flack on calls for inflation or worse stagflation.
And on paper, that is understandable.
A strong dollar, many commodities on 100-year lows, tariffs, slowing global demand, and overproduction, are all the logical factors keeping inflation down.
I like to think though about the X factor. And what is the X factor?
That’s the factor that economists and armchair economists do not see or account for.
It could start with the Federal Reserve cutting interest rates.
It could ignite if the dollar drops hard.
It could be because of an increase in chaos. The geopolitical situations around the world can certainly lead to more chaos.
Then, there is the hoarding mentality. In uncertain times, the psychology changes to investing in stocks to buying tangible goods. Gold is one for sure, but food comes into it as well.
Sure, there is automatization and increased efficiency in food and other industries, but who benefits from that? Third-world countries? China, who has been buying up raw materals around the world for years?
And when does that benefit take full affect? 5 years, 10, or more?
Which brings me back to the silver to gold ratio.
The bottom chart shows the ratio.
The black line is the longer-term trend or 6-month moving average of the gold to silver ratio.
The red line is the 50-day moving average.
When silver starts to outperform gold, that is bullish for both. Plus, it is a sign of inflationary factors beginning to emerge.
Currently, silver is under both MAs.
If silver clears the red line and also the 200-DMA on the top chart or green line, that is only an initial indication.
A move over the black line would be a more reliable signal.
And, should that occur, a good time to reassess logic, just as the bizarre sector rotation is forcing stock traders do right now.
S&P 500 (SPY) – Swing high at 291.42 with all-time high 293.94. 289 immediate support.
Russell 2000 (IWM) – 154.95 the 50 DMA to hold, especially on a closing basis. 156.08 the 200 DMA and 157.11 the 50-WMA.
Dow (DIA) – Swing high at 265.93. That means must hold 263.50
Nasdaq (QQQ) – New all-time high at 187.96. 186.40 now the support to hold.
KRE (Regional Banks) – 54.08 the 50-DMA this needs to clear/hold back over or could see 52.65 next.
SMH (Semiconductors) – All-time high at 118.83. What you do not want to see is a gap below 116.80, that does not get filled.
IYT (Transportation) – Swing high at 198.65. December 2018 high 199.09. 194.80 the support to hold.
IBB (Biotechnology) – 103.78 the 200-WMA to hold.
XRT (Retail) – 4.20 the 100-DMA support held. But ultimately, must hold 44.40 this week.
Twitter: @marketminute
The author may have a position in the mentioned securities at the time of publication. Any opinions expressed herein are solely those of the author, and do not in any way represent the views or opinions of any other person or entity.


