 By Andrew Nyquist
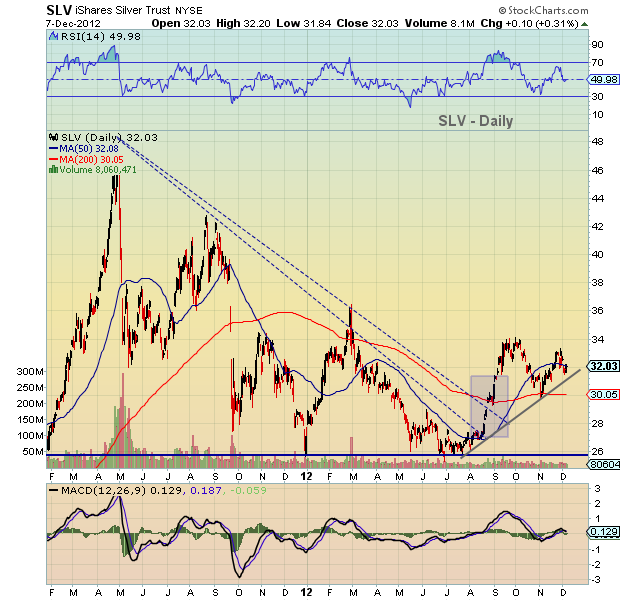
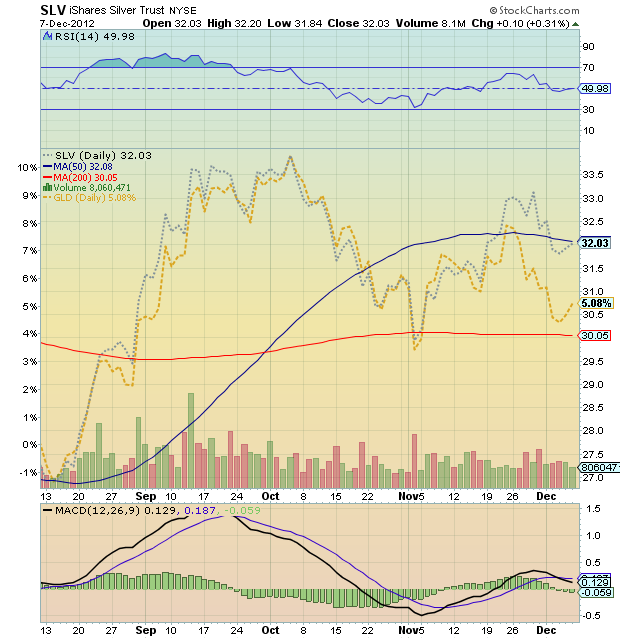
Although iShares Silver (SLV) has been hanging in there and showing relative strength compared to it’s big glittery brother, SPDR Gold Shares (GLD), I’m still concerned. Something just doesn’t look right. I’m no RSI expert, but it seems that the metal is losing strength and may want to retest it’s summer base and breakout area again. In short, the RSI burned hot all the way to SLV Silver’s 38.2 percent Fibonacci retracement ($34.12), but has weakened since. Furthermore, the late summer highs drove the RSI reading into the clouds.
But to keep myself honest (and for transparency sake, I do not have a current position in SLV – see disclaimers below), I always return to price and let technical levels speak for themselves. That said, SLV has some clearly defined support and resistance levels:
1) Support — Two levels below stick out: The near-term uptrend line (roughly 31.30) AND confluence of support at the recent lows ($29.84) and 200 day moving average ($30.05).
If these are lost, then SLV should retest its base.
2) Resistance — The September-October highs and 38.2 percent Fibonacci retracement level.
A move above this level would be bullish.
Trade safe, trade disciplined.
———————————————————
Twitter: @andrewnyquist and @seeitmarket Facebook: See It Market
No position in any of the securities mentioned at the time of publication.
Any opinions expressed herein are solely those of the author, and do not in any way represent the views or opinions of his employer or any other person or entity.


