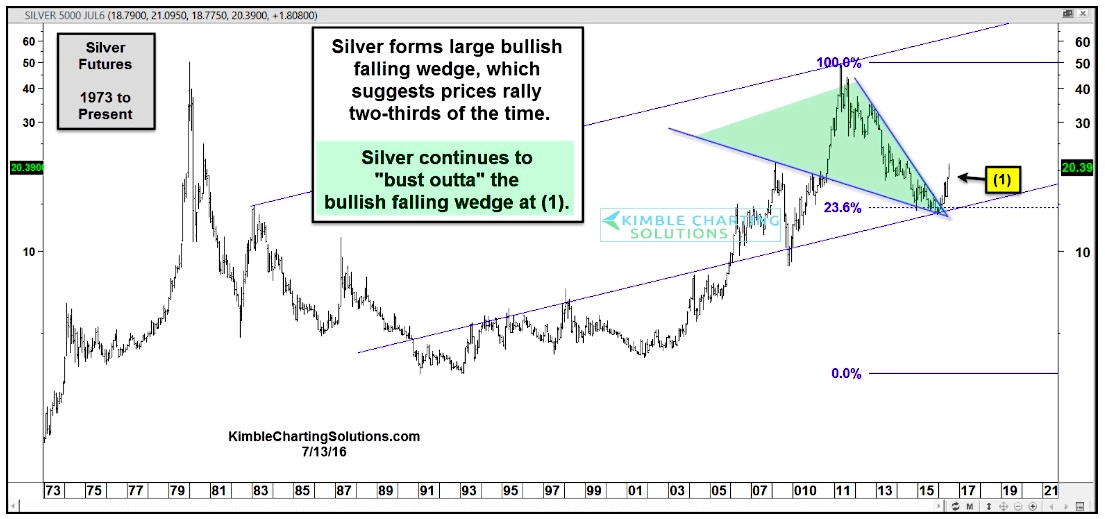
A multi-year downtrend had silver bulls singing the blues. But Silver Futures prices rallied hard in 2016. The rally in Silver (NYSEARCA:SLV) was so fierce that it triggered a silver breakout above the resistance line of a long-term bullish wedge pattern.
In short, when it comes to bullish falling wedges, you want prices to break out of the top of the pattern, just as silver has done.
Below is a chart of silver prices over the past 30 plus years.
It took silver quite some time to form the current falling wedge pattern. Notice that the tip of the wedge formed as prices approached two decade old support. As mentioned above, the recent silver breakout was triggered by a rally out of the falling wedge pattern. It continues to push higher at point [1] below.
Silver Futures Prices – Long-Term Chart
Ideally, silver prices will form a higher lower on a pullback and surge higher again. Thanks for reading and best of luck out there.
Twitter: @KimbleCharting
The author does not have a position in related securities at the time of publication. Any opinions expressed herein are solely those of the author, and do not in any way represent the views or opinions of any other person or entity.


