Just yesterday, we discussed the massive “cup with handle” formation on the gold price chart and how a breakout over $2200 could sent gold to historic price levels.
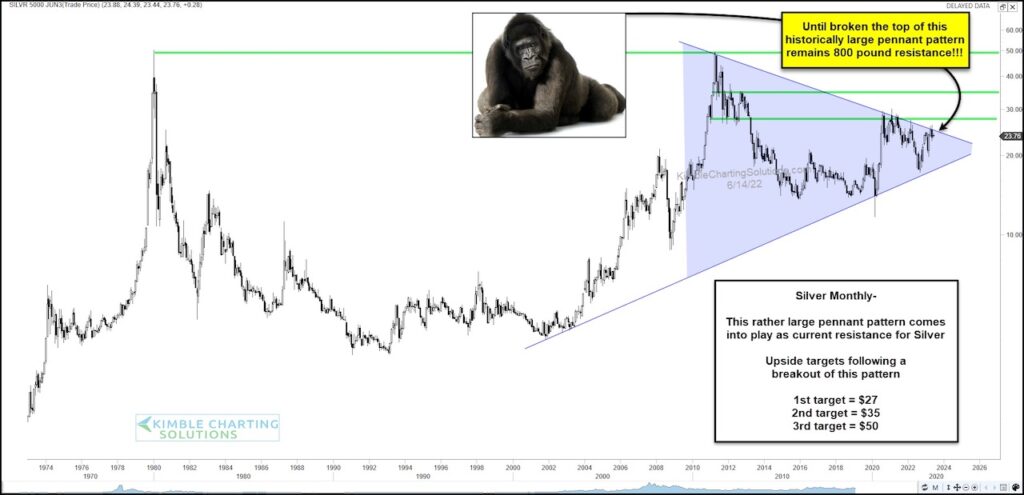
Today, we turn our attention to Silver, looking at a long-term “monthly” price chart.
As you can see, silver has formed a massive massive pennant pattern. And along the way, silver has tested the upper side of the pennant several times. This area remains 800 pound resistance!
BUT price is testing this area yet again… and if a breakout occurs, it would likely have massive implications for bulls.
In my humble opinion, if a breakout takes place here, there will be fun times ahead for Silver. Stay tuned!
Silver Futures “monthly” Price Chart

Note that KimbleCharting is offering a 2 week Free trial to See It Market readers. Just send me an email to services@kimblechartingsolutions.com for details to get set up.
Twitter: @KimbleCharting
Any opinions expressed herein are solely those of the author, and do not in any way represent the views or opinions of any other person or entity.


