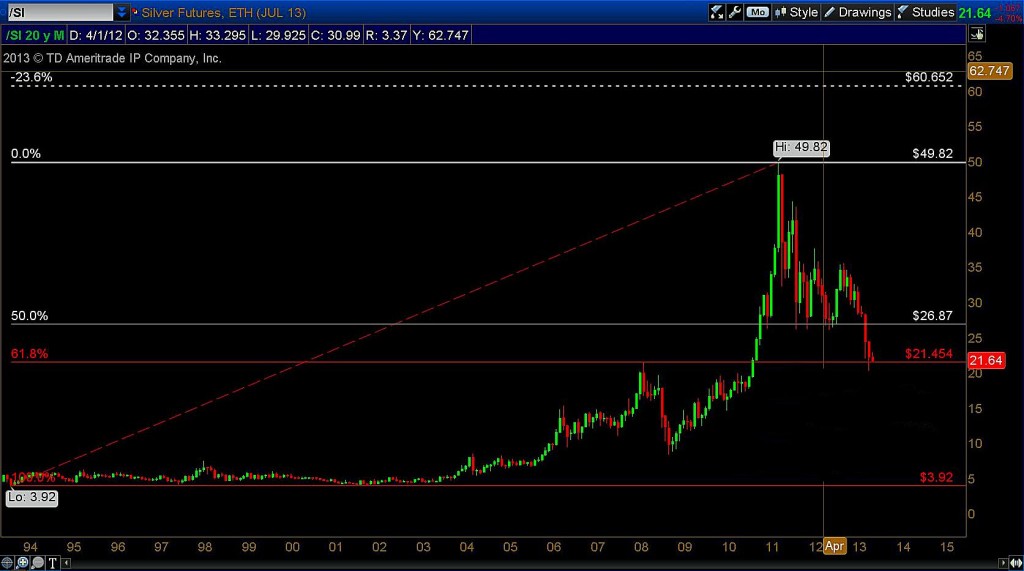
 To get a better idea of what’s happening with Silver, let’s start with a long-term view of price history. From the low of $3.92 in 1993 to the high of $49.82 in 2011, price increased by a massive +1170.91% (a +12 bagger) with +493.09% of the move occurring in just 30 months from October 2008 to April 2011.
In the 2o year chart below (through 2013), you can see that there were 2 Fibonacci support levels of 26.87 and 21.455. Price was able to hold the 1st support level for 18 months before dropping down to the 2nd support level, which could only hold 2 months.
Silver Monthly 20 Year Chart through July 2013
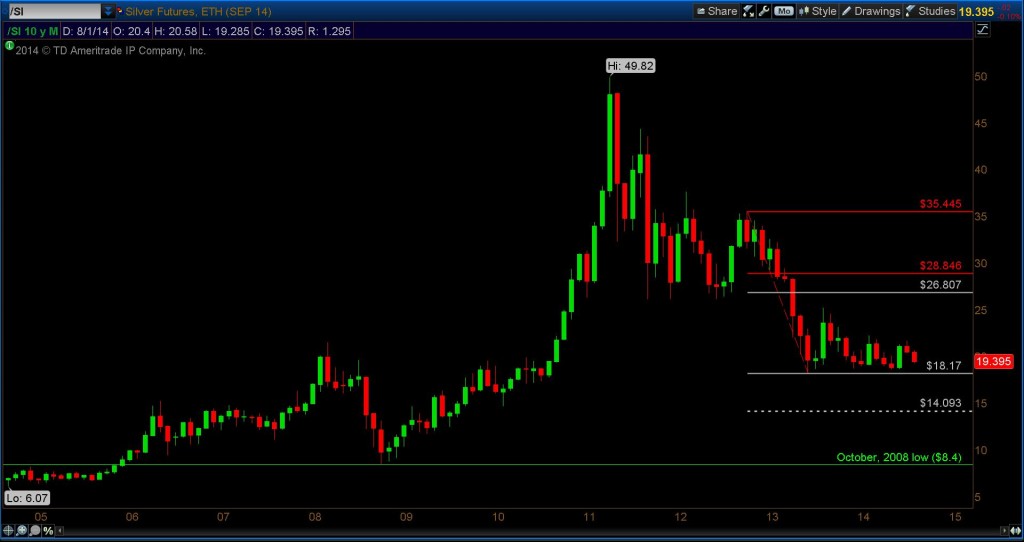
Now let’s start drilling down and and add some bars to present day to get a better idea of where Silver may be headed. We’ll start with a 10 year, monthly chart of Silver prices with the new Fibonacci draw that was created after price failed to hold 21.455.
In the chart below, you will see 2 resistance levels; 26.805 and 28.845 and a target of 14.095.
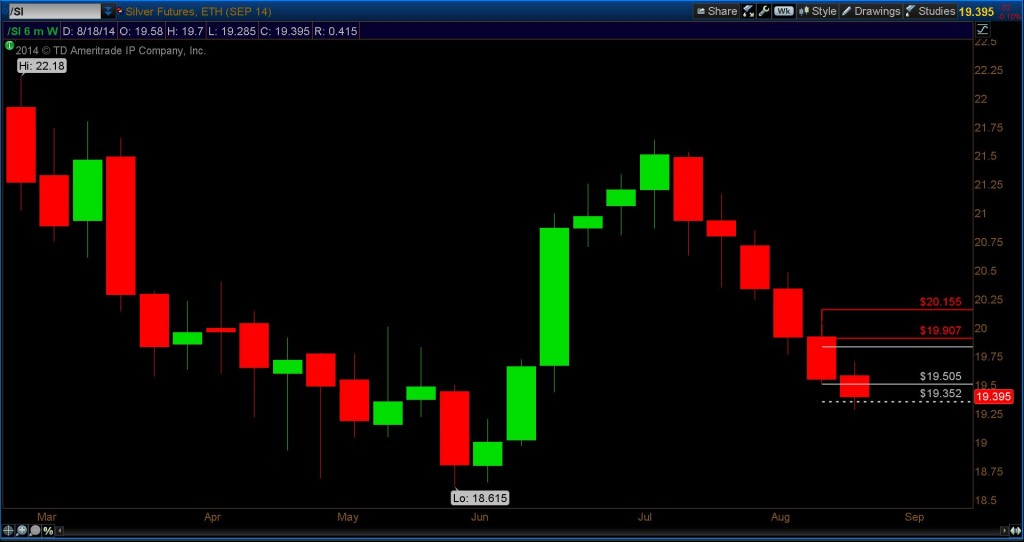
Now, let’s drill down to some shorter time frames for Silver. In the 6 month, weekly chart below, using my Fibonacci drawing method, I’ve derived a target of 19.355 which was hit and held for the week of August 18th, 2014. The overhead resistance levels are 19.83 and 19.905.
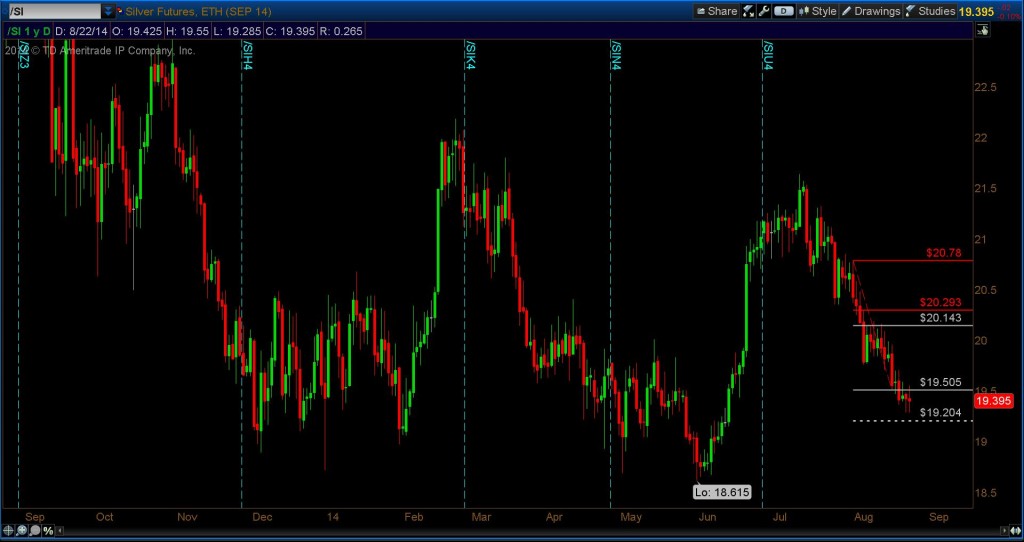
Again, using my Fibonacci drawing method on a 1 year, daily chart, we get a target of 19.205 with resistance at 20.14 and 20.29. Considering this daily target of 19.205 and the weekly target of 19.355 I would say $19 and change is the number that should be monitored closely for more weakness.
I’ll continue to monitor this and provide updates as necessary.
No position in any of the mentioned securities at the time of publication. Any opinions expressed herein are solely those of the author, and do not in any way represent the views or opinions of any other person or entity.


