 By Andrew Nyquist
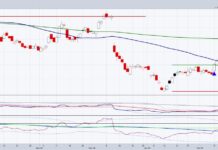
Since breaking out above its downtrend line, Silver (SLV) has rallied to the key Fibonacci retracement level of 38.2 percent ($34.12). This level has been, and will continue to be, a battleground for Silver bulls and bears.
Silver has spent the past few weeks working off overbought levels and consolidating gains under this key level. Yet while it has shown good relative strength and health, a move lower to recharge the batteries cannot be ruled out (and this may be healthy). But make no mistake, this fibonacci level is a very important intermediate term toggle.
Trade safe, trade disciplined.
More Charts here.
Silver (SLV) chart as of October 5, 2012. SLV chart with Fibonacci retracement levels and technical support and resistance. SLV long term chart with technical analysis.
———————————————————
Twitter: @andrewnyquist and @seeitmarket Facebook: See It Market
No position in any of the securities mentioned at the time of publication.
Any opinions expressed herein are solely those of the author, and do not in any way represent the views or opinions of his employer or any other person or entity.


