In a recent article, I highlighted the rally in Silver as a bullish signal for precious metals (and gold).
In that post, I took a look at a chart of the Silver ETF (SLV) and highlighted a prospective path forward to Silver.
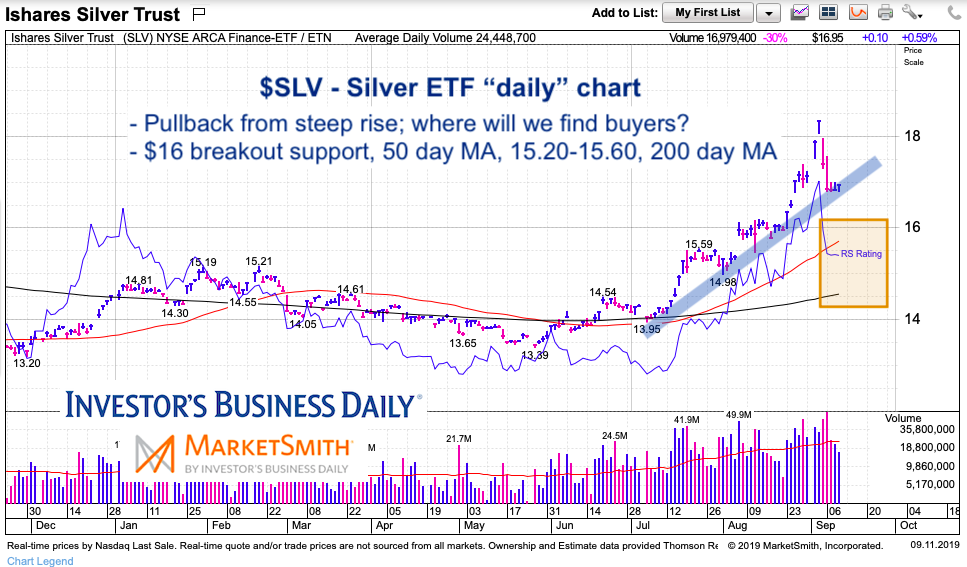
That forecast is playing out right now, as $SLV rallied up to $18.35 before falling back below $17. As a reminder, precious metals (and especially gold – GLD) derive its “juice” for lasting rallies from bullish acting Silver prices.
Today, I will take another look at the Silver SLV chart and re-iterate key support levels to watch.
Note that the following MarketSmith charts are built with Investors Business Daily’s product suite.
I am an Investors Business Daily (IBD) partner and promote the use of their products. The entire platform offers a good mix of technical and fundamental data and education.
Silver ETF (SLV) Price Chart
The $16 level continues to be important breakout support. If this level gives way, it could serve to neutralize Silver to a holding pattern. There is a confluence of support between $15 and $15.75 that is secondary support.
What bulls do not want to see is a steep rally that fails and turns into a steep decline.

For reference, here is the prior chart I shared:
$SLV rose up to $18.35… now down to 16.86. Playing out as depicted below. BUT $15.75-$16.00 is line in sand. #IBDpartner https://t.co/6KSlx7eU3I
— Andy Nyquist (@andrewnyquist) September 11, 2019
Twitter: @andrewnyquist
The author may have a position in mentioned securities at the time of publication. Any opinions expressed herein are solely those of the author, and do not in any way represent the views or opinions of any other person or entity.


