When we discuss bull markets and areas of leadership, we usually point to out-performance.
We’ve been writing a lot about precious metals lately, and today we look at Silver.
Two things we love to see: Silver out-performing Gold (sign of risk-on), and precious metals out-performing the stock market (leadership and prospect of a Silver bull market starting).
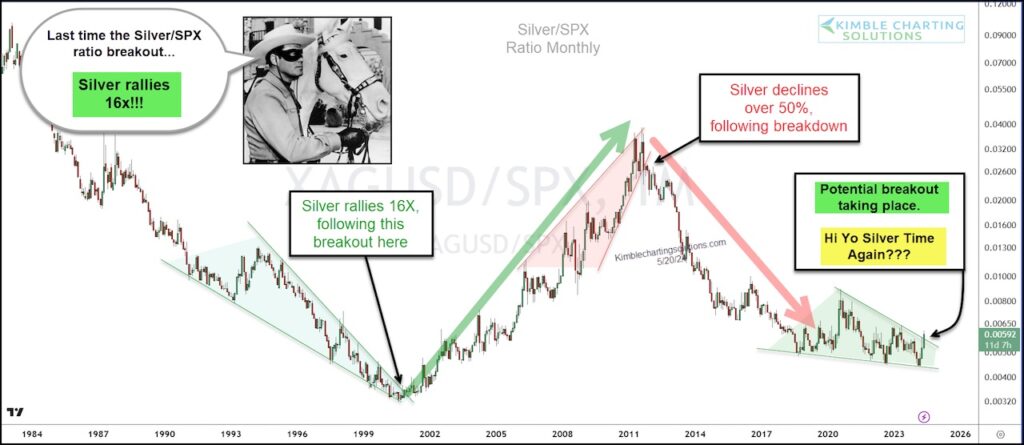
Today’s long-term “monthly” chart looks at the performance ratio of Silver to the S&P 500 Index. Silver bulls want to see this ratio heading higher. And lately it has been.
In fact, if we look closer we can see a potential breakout of Silver/S&P 500 ratio taking place this month!
The last time this took place from oversold conditions, Silver rallied 16x (from $3 to $50). Is another Silver bull market starting? Stay tuned!
Silver / S&P 500 Index “monthly” Ratio Chart

Note that KimbleCharting is offering a 2 week Free trial to See It Market readers. Just send me an email to services@kimblechartingsolutions.com for details to get set up.
Twitter: @KimbleCharting
The author may have a position in mentioned securities. Any opinions expressed herein are solely those of the author, and do not in any way represent the views or opinions of any other person or entity.


